Love coinbase and Robin Hood. But as a retail investor it is tough to pull the trigger.
-
Comment -
Yeah, I miss Slurry's updates and commentary.
Originally posted by homie1975Comment -
We will carry on with or without him.Originally posted by ex50warrior
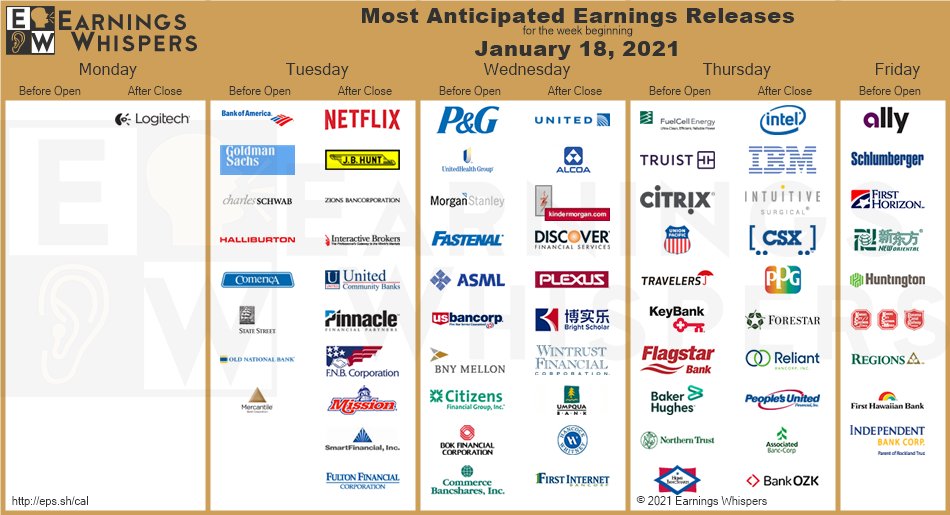
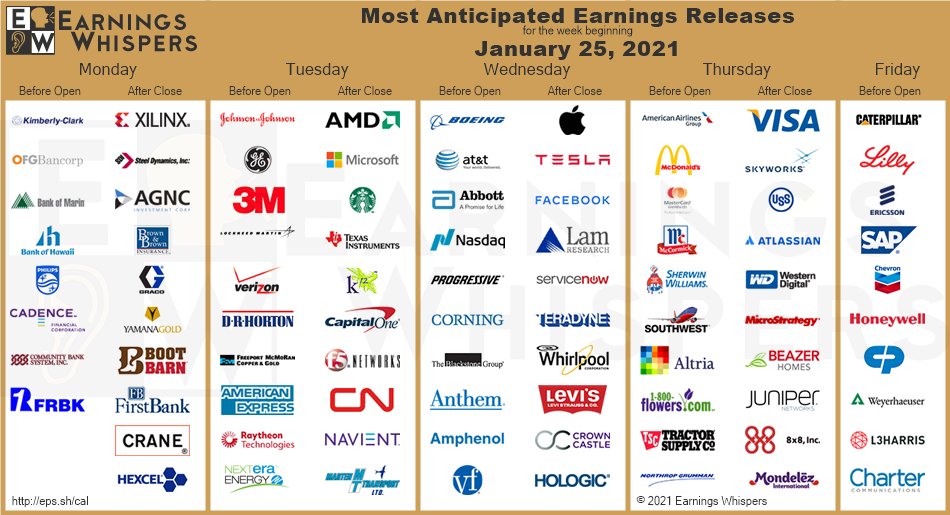
This next week is very interesting as we have the Biden stim heading up against continuing political turmoil and discord.
There are macro factors in play as we kick off earnings season.Comment -
Isn't Biden stim already announced and baked in? Only thing on that now is if it somehow gets derailed and diminished.Originally posted by homie1975Comment -
Yes he's seeking bipartisan support, he's not trying to ram it through, so there are obstacles.Originally posted by d2betsComment -
So what's the catalyst? I guess earnings season is approaching. Maybe the market will move on actual earnings - quaint notion. Does anybody care about P/E ratios anymore? It's all QE infinity, stim and vaccines.Originally posted by homie1975Comment -
And big techOriginally posted by d2betsComment -
market closed due to MLK but let's see what the day's futures look like in the afternoon/evening. right now mostly trading sideways.Comment -
Comment -
Iona thanks much, please keep posting the great earning sched as you've been doing the last year or two.Comment -
SCR up another 16% today $$$Comment -
How the market is closed? Oh nvm your in CanadaOriginally posted by CanuckGComment -
LOL i was wondering the same thingOriginally posted by allabout the $$$Comment -
Comment -
Unusual divergence between Bitcoin price and MARA/RIOT?Comment -
At a minimum, look into RECAF and tell me what y'all think. I'm heavily invested here.Comment -
NY Governor is a clown. Watching my PENN drop as he says he wants things state run. Moron.Comment -
The sheet is about to hit the fan. Any growth is untenable. Must watch charts. Only facts. Powell will be proven very very wrong.
 Comment
 -
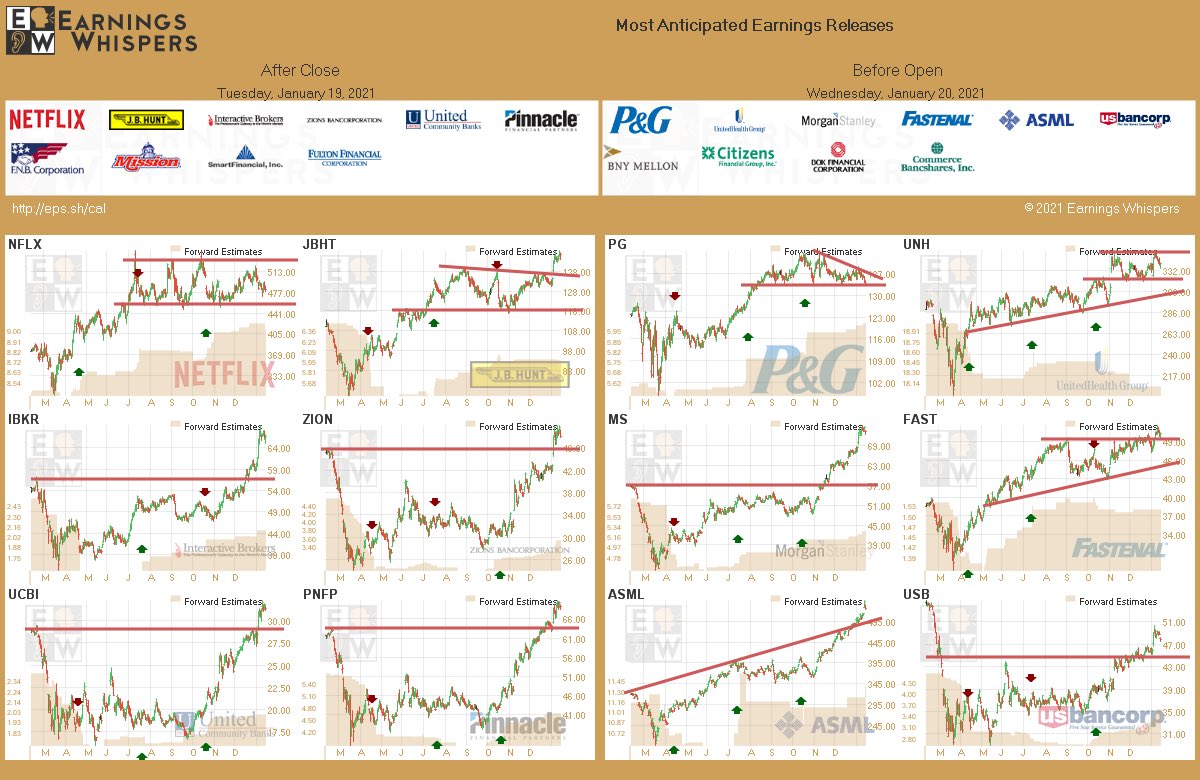
NFLX pops big on subscriber growth. can it sustain with coming up w/ new content regularly vs all of the other consumption choices? so far so good.Comment -
NFLX ignited a rally in the FANG stocks and all boats are rising w/ the tideComment -
Comment -
LLNW replacing CEO Feb. 1st! Huge news boys. Get in now. This stock was trading under 2x revenue when a stock like Fastly, same industry and similar revenue, is at 30x. This stock was way undervalued already. This new CEO "gets it". He is a growth and investor value guy. Dropping the story on Inaguration Day should mean tomorrow and Friday things continue upward. Already jumped 7%+ today with more to come.Comment -
Topper, show us the (lime) lightComment -
Ended up about 9% yesterday, premarket showing a surge at the open today.Originally posted by homie1975Comment -
Comment -
think roy bacon was arrested at the capital... here is a new one for you guys. uwmc pays a divy. used to be ghivComment -
CHICO !! good to see you, FriendOriginally posted by chico2663Comment -
Fasten your seat belts
Comment -
Does anyone know how to get in on an ipo?Comment -
Hey ya'll, I'm back after a little Christmas break, and then a trip to a third world shyt hole for work. Cause as it turns out, if your in the business of digging holes, eventually you dig a hole that fills up with water quicker than you can remove it. That's when you call in the Slurry Pumper to solve your problems. Anyway, so now that I'm back, we might as well see what the stocks I own are doing.
AQB: Aquabounty Technologies INC.
OK this is the company that genetically altered some salmon to make them grow faster, then decided to build a facility in Kentucky to farm them. I think eventually this type of quick growing meat market will catch on more than the fake veggie meat them pinko vegans have been pushing on us. If them plant growing burger guys want to impress me, lets see if they come up with something that taste like vegetables but make out of meat. In the mean time, I'm going with a business that makes meat faster and with less resources. Yay America!
TOTALS ALL STOCKS 2020 46,101.00 -5,857.00 2,171.00 853.53 MONTH JAN IN 0.00 ALLOWED 0.00 GAIN SO 0.00 TOTAL -93.50 TOTALS PER STOCK AQB PLAY 1,131.00 LOSS 1,524.00 FAR 2,490.00 GAIN 885.50 MONTH JAN 0.00 0.00 0.00 0.00 STOCKS DATE TIME STOCK
TICKERSHARES BEGIN
BUY/SELL
PRICETOTAL
IN PLAYSET
STOP LOSS
PRICEALLOWABLE
LOSS TOTALALLOW
LOSS
% TOTALTODAY'S
CLOSE/END
PRICEGAIN/LOSS
SO FAREND
SHARESEND
BUY/SELL
PRICEEND
GAIN/LOSSEND
%
GAIN/LOSSTOTAL
GAIN/LOSSTOTAL
%
GAIN/LOSSPARTIAL 1
SHARESPARTIAL 1
BUY/SELL
PRICEPARTIAL 1
GAIN/LOSSPARTIAL 1
%
GAIN/LOSSPARTIAL 2
SHARESPARTIAL 2
BUY/SELL
PRICEPARTIAL 2
GAIN/LOSSPARTIAL 2
%
GAIN/LOSSPARTIAL 3
SHARESPARTIAL 3
BUY/SELL
PRICEPARTIAL 3
GAIN/LOSSPARTIAL 3
%
GAIN/LOSS10/28/20 9.54.34 AQB 400 3.77 1,131.00 8.85 1,524.00 134.75% 12.07 2,490.00 100 8.06 429.00 113.79%
I bought this one back at the end of October and it hasn't disappointed.

OK what is not to like about this weekly chart. Its gone parabolic so I'll sit on this for a while and wait for a pullback, and depending on where is shakes out, I may sell some and pick it up later or just sit on it and buy some more after it takes a rest. I bought this back when it was at $3.77, and I now have my stop loss set at $8.85 which is about 30% or so lower that the current price. I think I'll reset my stop loss this week to a level closer to the current price, but I think this stock is just starting out. Pretty soon we will all be choking down this super salmon as this company isn't even at the point of selling stuff yet. If they can get that hurdle down, this could continue to grow like the fake meat stocks.
AU: Anglogold Ashanti LTD
This is a gold mining play that hasn't done shyt for the last month, and before that it was coming down from a high of $38.50. Now that high price seems pretty far away, but I still think this is the year of the miner, with things like gold, silver and a whole bunch of metals that nobody knows what they are used for suddenly finding themselves in need.
The table shows that I am a steady buyer with purchases at the $28.01, $25.50, and $20.84 level. All in all, I'm down currently, but soon this company will report and there is no reason why it shouldn't be a blow out report. Their main product gold has remained above $1800 for the last 6 months.TOTALS ALL STOCKS 2020 46,101.00 -5,857.00 2,171.00 853.53 MONTH JAN IN 0.00 ALLOWED 0.00 GAIN SO 0.00 TOTAL -93.50 TOTALS PER STOCK AU PLAY 9,519.00 LOSS -1,715.00 FAR -235.00 GAIN 1,763.98 MONTH JAN 0.00 0.00 0.00 0.00 STOCKS DATE TIME STOCK
TICKERSHARES BEGIN
BUY/SELL
PRICETOTAL
IN PLAYSET
STOP LOSS
PRICEALLOWABLE
LOSS TOTALALLOW
LOSS
% TOTALTODAY'S
CLOSE/END
PRICEGAIN/LOSS
SO FAREND
SHARESEND
BUY/SELL
PRICEEND
GAIN/LOSSEND
%
GAIN/LOSSTOTAL
GAIN/LOSSTOTAL
%
GAIN/LOSSPARTIAL 1
SHARESPARTIAL 1
BUY/SELL
PRICEPARTIAL 1
GAIN/LOSSPARTIAL 1
%
GAIN/LOSSPARTIAL 2
SHARESPARTIAL 2
BUY/SELL
PRICEPARTIAL 2
GAIN/LOSSPARTIAL 2
%
GAIN/LOSSPARTIAL 3
SHARESPARTIAL 3
BUY/SELL
PRICEPARTIAL 3
GAIN/LOSSPARTIAL 3
%
GAIN/LOSS09/02/20 11.27.15 AU 300 28.01 2,801.00 19.51 -850.00 -30.35% 23.21 -480.00 85 28.51 42.50 1.79% 115 28.57 64.40 2.00% 10/22/20 15.39.11 AU 100 25.50 2,550.00 19.51 -599.00 -23.49% 23.21 -229.00 11/24/20 14.15.24 AU 200 20.84 4,168.00 19.51 -266.00 -6.38% 23.21 474.00

Look at this shyt. This company has been hanging around the $23.00 level for the last 2 months now, and technically it has "broken" out of the downward channel it has been in since August. It is also right at about a 50% retracement level from the highs. Although the term breakout really isn't the word, it really has been just maintaining the current price long enough to slide out of the channel so looking at the other indicators tells me that the MACD is rising and has been for a while now while the stochastics are also creeping up with no effect on the price. Take a look at the monthly chart and you'll wonder why would I own this. I know the charts look like crap but the fundamentals are all on the side of higher prices coming. Of course no one buys on fundamentals anymore, so maybe in a few weeks when they report, the earnings will have an effect.
GDX: Vaneck Vectors ETF Gold Miners
This is the basket of gold miners that I have. I like to own a basket of gold miners because there are several companies out there with some of them being top notch operations and others like the one I visited the last couple of weeks are known as shyt holes.
TOTALS ALL STOCKS 2020 46,101.00 -5,857.00 2,171.00 853.53 MONTH JAN IN 0.00 ALLOWED 0.00 GAIN SO 0.00 TOTAL -93.50 TOTALS PER STOCK GDX PLAY 14,622.00 LOSS -3,438.00 FAR -530.00 GAIN 1,706.95 MONTH JAN 0.00 0.00 0.00 0.00 STOCKS DATE TIME STOCK
TICKERSHARES BEGIN
BUY/SELL
PRICETOTAL
IN PLAYSET
STOP LOSS
PRICEALLOWABLE
LOSS TOTALALLOW
LOSS
% TOTALTODAY'S
CLOSE/END
PRICEGAIN/LOSS
SO FAREND
SHARESEND
BUY/SELL
PRICEEND
GAIN/LOSSEND
%
GAIN/LOSSTOTAL
GAIN/LOSSTOTAL
%
GAIN/LOSSPARTIAL 1
SHARESPARTIAL 1
BUY/SELL
PRICEPARTIAL 1
GAIN/LOSSPARTIAL 1
%
GAIN/LOSSPARTIAL 2
SHARESPARTIAL 2
BUY/SELL
PRICEPARTIAL 2
GAIN/LOSSPARTIAL 2
%
GAIN/LOSSPARTIAL 3
SHARESPARTIAL 3
BUY/SELL
PRICEPARTIAL 3
GAIN/LOSSPARTIAL 3
%
GAIN/LOSS09/04/20 10.29.46 GDX 50 39.91 1,995.50 27.96 -597.50 -29.94% 35.23 -234.00 09/21/20 10.13.53 GDX 50 40.10 2,005.00 27.96 -607.00 -30.27% 35.23 -243.50 10/22/20 15.50.42 GDX 50 39.20 1,960.00 27.96 -562.00 -28.67% 35.23 -198.50 10/26/20 11.13.22 GDX 50 38.63 1,931.50 27.96 -533.50 -27.62% 35.23 -170.00 11/24/20 14.12.15 GDX 200 33.65 6,730.00 27.96 -1,138.00 -16.91% 35.23 316.00
Just like AU, I'm a steady buyer of the GDX as well. So far since I have started this chart, I've been losing, but the walls of the kingdom are holding up and soon I expect these things will continue to pay off for me.

Just like AU this chart hasn't done much in the last couple of months. So I'll just move right along now.
GLD: SPDR Gold Trust ETF
Its gold with this one, or is it. I'm putting on the tin foil hat here a little to tell you that it really isn't. So every year with this being no exception, I sell off a little bit from the market and then use that money to buy 5 oz chunks so that I can hang on to it myself. I like the 5 oz chunks because it has less premium than the 1 oz coins while still being able to jam up your ass if you need to hide it. Really that is the reason. I need to be able to smuggle this in my ass if need be so I can transport it. Anyway, if I never need to transport it anywhere before I croak, I'll give it to the kids and they will surely do the whole Pulp Fiction watch thing. Not really they are all dumb asses that don't know shyt except how to procreate like rabbits so I expect them to liquidate as soon as getting the chunks but in that case what do I care, I'll be taking a dirt nap anyway.
TOTALS ALL STOCKS 2020 46,101.00 -5,857.00 2,171.00 853.53 MONTH JAN IN 0.00 ALLOWED 0.00 GAIN SO 0.00 TOTAL -93.50 TOTALS PER STOCK GLD PLAY 16,960.00 LOSS -1,609.00 FAR 430.00 GAIN 677.03 MONTH JAN 0.00 0.00 0.00 0.00 STOCKS DATE TIME STOCK
TICKERSHARES BEGIN
BUY/SELL
PRICETOTAL
IN PLAYSET
STOP LOSS
PRICEALLOWABLE
LOSS TOTALALLOW
LOSS
% TOTALTODAY'S
CLOSE/END
PRICEGAIN/LOSS
SO FAREND
SHARESEND
BUY/SELL
PRICEEND
GAIN/LOSSEND
%
GAIN/LOSSTOTAL
GAIN/LOSSTOTAL
%
GAIN/LOSSPARTIAL 1
SHARESPARTIAL 1
BUY/SELL
PRICEPARTIAL 1
GAIN/LOSSPARTIAL 1
%
GAIN/LOSSPARTIAL 2
SHARESPARTIAL 2
BUY/SELL
PRICEPARTIAL 2
GAIN/LOSSPARTIAL 2
%
GAIN/LOSSPARTIAL 3
SHARESPARTIAL 3
BUY/SELL
PRICEPARTIAL 3
GAIN/LOSSPARTIAL 3
%
GAIN/LOSS11/24/20 13.39.32 GLD 100 169.60 16,960.00 153.51 -1,609.00 -9.49% 173.90 430.00
With me selling half of my shares, it actually looks like I am making profits with the gold trade. I can assure you that all the profits are due to the run up in the first half of last year. I think it returns soon to the mountain climbing routine because we are getting more stimulus and printers around the globe are working overtime. Eventually this will have an effect.

Lets take a look at the weekly chart and see that when the stimulus came into play last month, gold spiked up a little bit but then got beat down. I wouldn't be surprised if GLD comes back down to test the $166 level before it starts to climb from there. In fact I kind of expect it, and that is when I will employ my cash to buy the actual stuff to jam up my ass if need be. If that doesn't happen, I'll be buying the actual stuff when GLD gets above the $183 level.
SLV: Ishares Silver Trust ETF
Hey I bought some silver finally, I've been meaning to to it for a while, and when I sold off a 100 of the GLD, I thought that I had a few bucks left to start buying the silver. This metal is very important for the green new deal industry. This and stuff like Palladium and Unobtainium, and Chromium. I'm not going to stack this just because, if you have been following my tin foil hat theory, I only have so much room in my ass so I save that area for more expensive stuff like gold.
TOTALS ALL STOCKS 2020 46,101.00 -5,857.00 2,171.00 853.53 MONTH JAN IN 0.00 ALLOWED 0.00 GAIN SO 0.00 TOTAL -93.50 TOTALS PER STOCK SLV PLAY 2,361.00 LOSS -361.00 FAR 5.00 GAIN 0.00 MONTH JAN 0.00 0.00 0.00 0.00 STOCKS DATE TIME STOCK
TICKERSHARES BEGIN
BUY/SELL
PRICETOTAL
IN PLAYSET
STOP LOSS
PRICEALLOWABLE
LOSS TOTALALLOW
LOSS
% TOTALTODAY'S
CLOSE/END
PRICEGAIN/LOSS
SO FAREND
SHARESEND
BUY/SELL
PRICEEND
GAIN/LOSSEND
%
GAIN/LOSSTOTAL
GAIN/LOSSTOTAL
%
GAIN/LOSSPARTIAL 1
SHARESPARTIAL 1
BUY/SELL
PRICEPARTIAL 1
GAIN/LOSSPARTIAL 1
%
GAIN/LOSSPARTIAL 2
SHARESPARTIAL 2
BUY/SELL
PRICEPARTIAL 2
GAIN/LOSSPARTIAL 2
%
GAIN/LOSSPARTIAL 3
SHARESPARTIAL 3
BUY/SELL
PRICEPARTIAL 3
GAIN/LOSSPARTIAL 3
%
GAIN/LOSS01/22/21 10.03.24 SLV 100 23.61 2,361.00 20.00 -361.00 -15.29% 23.66 5.00

Taking a look at this chart shows us that after running up, it has been hanging around dot really declining that much. Biden has already stopped a few nasty, dirty fossil fuel related stuff, and I can bet that soon they will throw a couple of trillion into the renewables like solar, wind, and other stuff. Silver will like that very much.
SPH: Suburban Propane Partners LP
I got propane running just about all of my stuff in the home like the furnace, the stove, the laundry dryer, the heater in the green house, and even my garage heater. Hell I got a giant 1000 pound tank sitting out in the yard. One of these days when I've had enough, I may just open up all the valves in all of the lines and smoke a blunt while having all of the gold chunks jammed up my ass on Easter. I would be my parting gift to the family and finally I could get the kids excited about and easter egg hunt. Anyway, this play is more a utility than anything else, and I thin utilities are not in favor lately. No one is working so they're not paying the mortgage or rent so you know they are also not paying for the electric, gas, or any other utility unless you count Netflix in the mix.
TOTALS ALL STOCKS 2020 46,101.00 -5,857.00 2,171.00 853.53 MONTH JAN IN 0.00 ALLOWED 0.00 GAIN SO 0.00 TOTAL -93.50 TOTALS PER STOCK SPH PLAY 1,508.00 LOSS -258.00 FAR 11.00 GAIN 110.00 MONTH JAN 0.00 0.00 0.00 0.00 STOCKS DATE TIME STOCK
TICKERSHARES BEGIN
BUY/SELL
PRICETOTAL
IN PLAYSET
STOP LOSS
PRICEALLOWABLE
LOSS TOTALALLOW
LOSS
% TOTALTODAY'S
CLOSE/END
PRICEGAIN/LOSS
SO FAREND
SHARESEND
BUY/SELL
PRICEEND
GAIN/LOSSEND
%
GAIN/LOSSTOTAL
GAIN/LOSSTOTAL
%
GAIN/LOSSPARTIAL 1
SHARESPARTIAL 1
BUY/SELL
PRICEPARTIAL 1
GAIN/LOSSPARTIAL 1
%
GAIN/LOSSPARTIAL 2
SHARESPARTIAL 2
BUY/SELL
PRICEPARTIAL 2
GAIN/LOSSPARTIAL 2
%
GAIN/LOSSPARTIAL 3
SHARESPARTIAL 3
BUY/SELL
PRICEPARTIAL 3
GAIN/LOSSPARTIAL 3
%
GAIN/LOSS11/04/20 15.01.46 SPH 100 15.08 1,508.00 12.50 -258.00 -17.11% 15.19 11.00 
Not much going on here, but it does look like it is due for a run.
So since I've been away for the last month, I even have a Scanner stock to share:
FLEX: Flex LTD.
OK I have no idea what they do but who cares, the scanner picked them up Friday, and if it stays above the 9 DMA on Monday, I'll be buying it. Take a look at the daily chart.
 Comment
 -
cciv should be golden. spac that is going to be lucid motors. at least that is rumor. Can see it being 60 by end of year.
Comment -
Hey Slurry,
Are you calculating your stop/loss manually or do you use software?
I'm useless with charts/scholastics etc. Would love some help with volatility evaluations per position. I'm getting better with my "trailing stop loss %" but still getting bit more than I'd like.
Glad to see you back!Comment -
AQB, seems like everything I look at nowadays I'm a month or more late. Seems similar here?Comment -
I use charts for figuring out my stop losses. All my gold related stuff have no stop losses because I just hold onto it forever anyway so why bother, I just buy more when it gets cheap enough and sell sometimes when I think we are near a top.Originally posted by Madison
Other long term plays like AQB I like to use charts to guide me for a stop loss. I haven't been paying attention to AQB, so looking at it now on a daily chart.

I placed a line right at $10.31 because if you look at the daily chart the market is telling us that this is an important number. The price spiked through on 12/7 and 12/9 before it got rejected, then came right back up there before Christmas on 12/22 and 12/23. Came close again on 1/7, spike through again on 1/8 before getting above the price on 1/13. Now the price has tested this level as support from 1/14 - 1/17 before it started to trade away just last Wednesday with follow through with a pretty solid day on Friday. So going forward, I'm going to set my stop loss for this stock just below the 10.31 price probably at $10 because I think it is on a run and I'l lgive it some room since it has done well for me. Any retest of former support will be brief I think so if it does spike down past 10.31, I'll give it a little room to dip below. I will also set up a criteria based stop loss that states the price will need to close a daily candle below . Of course one day if it comes back down to $10 buck and keeps falling to say $8, my stop loss won't get triggered until the next trading day. That is the chance I'll take because I think under normal garden variety conditions it won't drop much below $10 if it even drops that far.
If I'm thinking of buying now, my stop loss would be just below the $11.02 level which is the bottom of the break up candle from Friday. That was a pretty sizable move, so the price may come back down to test the low of the break up candle and if it doesn't hold, that may be a sign that there is more selling to come. Below that, the 20 DMA of $10.71 should offer a little support and is another good area for a stop loss.
Keep in mind that since the price is going parabolic on the weekly chart, a stock can maintain that for while but usually it comes down just as fast when it starts to come down. I really like to see a price move up and hang around at a price for a while before continuing a move. It kind of shows that the move was justified. Parabolic moves are sometimes a sign of hype machine, which in this case could be the case. This business is still in the infancy stage and they don't really sell a product yet. Just a few weeks ago, they offered more stock so that they can build a farming set up in Kentucky so. If they screw that up, you can see this thing fall apart pretty quick. If they perform well with managing the farm and selling cheap fast genetically altered salmon with out people flipping out or getting sick, then we can have cheap salmon and high stock prices by the end of the year.Comment -
Always very much appreciated, but too often you are over my head as charting is just not a strong suit of mine. But again thanks!Originally posted by Slurry PumperComment