Oh Gee...Let's see how the flu season is progressing in the U.S.A.
Where did all of that GREEN come from??
Green is very low......Minimal outbreak.
Must be the WUHAN effect.~~

Weekly US Map: Influenza Summary Update
2020-21 Influenza Season Week 53 ending Jan 02, 2021
State Activity Indicator Map
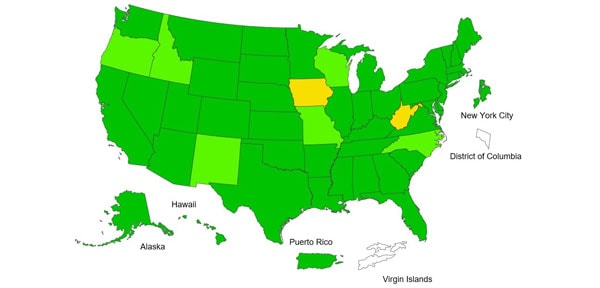
Data collected in ILINet are used to produce a measure of ILI(influenza like illness) activity* by state. Activity levels are based on the percent of outpatient visits in a state due to ILI.
homeSeasonal Influenza (Flu)
~~ILI Activity Level
Very HighHighModerateLowMinimalInsufficient Data
Where did all of that GREEN come from??
Green is very low......Minimal outbreak.
Must be the WUHAN effect.~~
CDC In Action
Weekly US Map: Influenza Summary Update
2020-21 Influenza Season Week 53 ending Jan 02, 2021
State Activity Indicator Map
Data collected in ILINet are used to produce a measure of ILI(influenza like illness) activity* by state. Activity levels are based on the percent of outpatient visits in a state due to ILI.
Page last reviewed: January 8, 2021, 11:00 AMContent source: Centers for Disease Control and Prevention, National Center for Immunization and Respiratory Diseases (NCIRD)
homeSeasonal Influenza (Flu)
~~ILI Activity Level
Very HighHighModerateLowMinimalInsufficient Data