Stock Market Discussion -- started 03/06/2018 -- updated daily !!!

Collapse
X
 
  • Time
  • Show
Clear All
new posts
  • chico2663
    BARRELED IN @ SBR!
    • 09-02-10
    • 36915

    #8226
    Originally posted by Lineman
    you guys failed to mention NBAC...come on now, don't fall asleep at the wheel...: ))
    Reminds me of the 90s this market, exciting times.....
    Just got in couple of more stuff yesterday and today, posted the charts in tradingview.
    Happy turkeys!

    have it on watch list. was between that and lgvw. Figured i had enough in ev's. good luck.
    Comment
    • chico2663
      BARRELED IN @ SBR!
      • 09-02-10
      • 36915

      #8227
      thank god for tsla and nio or would of had a bloody nose.
      Comment
      • chico2663
        BARRELED IN @ SBR!
        • 09-02-10
        • 36915

        #8228
        just bought more sbe,nio,wkhs and xpev
        Comment
        • navyblue81
          SBR MVP
          • 11-29-13
          • 4143

          #8229
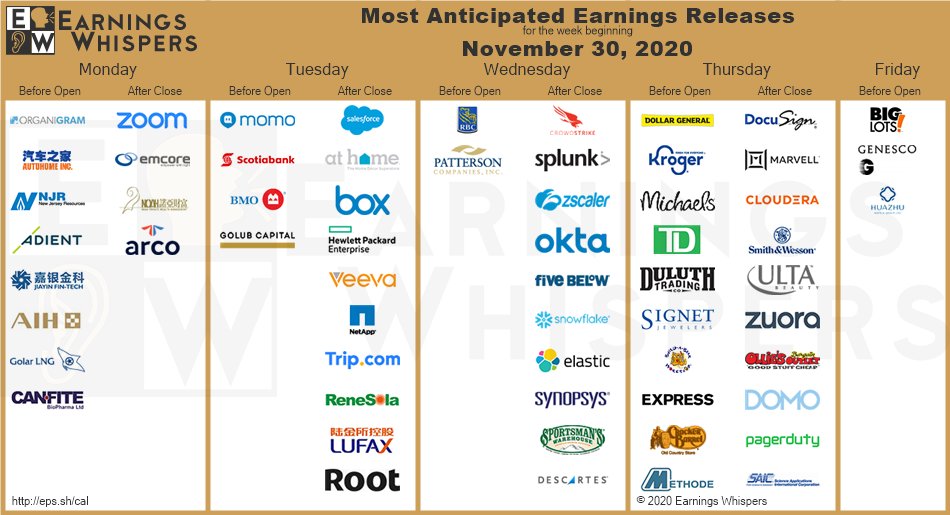
          Curious people’s thoughts on SNOWFLAKe. I just put a big investment into it...got it at 325. Up 25% in a week and 33% since opening last month. I really like the steady growth over its had and could be a good buy for the holidays.
          Just curious if anyone else is invested in it.
          Last edited by navyblue81; 11-27-20, 10:12 AM.
          Comment
          • RoyBacon
            BARRELED IN @ SBR!
            • 09-21-05
            • 37074

            #8230
            FSLR up another $4.

            Solar. It’s the big winner as Biden goes green deal lite and woke punishes fossil fuels.
            Comment
            • chico2663
              BARRELED IN @ SBR!
              • 09-02-10
              • 36915

              #8231
              ccl doing well
              Comment
              • kaliboyz
                SBR MVP
                • 10-30-09
                • 3121

                #8232
                Y'all want some unicorn stocks?

                Research

                TSNP (Paypal wantta be) <=== running crazy
                TSPG ( essential electric vehicle)
                PUGE (covid 3D technology)
                Comment
                • kaliboyz
                  SBR MVP
                  • 10-30-09
                  • 3121

                  #8233
                  Originally posted by kaliboyz
                  Y'all want some unicorn stocks?

                  Research

                  TSNP (Paypal wantta be) <=== running crazy
                  TSPG ( essential electric vehicle)
                  PUGE (covid 3D technology)
                  Anyone get in TSNP? Raise your hand.. This shit getting wild..

                  I'm in 100,000 shares at .05 ... Up 100%
                  Comment
                  • Iona
                    SBR MVP
                    • 01-08-10
                    • 4244

                    #8234
                    Comment
                    • Slurry Pumper
                      SBR MVP
                      • 06-18-18
                      • 2811

                      #8235
                      Ok I was out playing around last week so I didn't post how my long term positions are doing. The market continues to drift up and I think the greed index is now over 90% bullish which alone is enough for me to say we are heading for a downturn in the market. Of course even after the buys this week, I'm staying mostly on the sidelines playing the UPRO and SPXU with scalp and swing trades. I did substantially increase most of my positions so lets get right to it.

                      AQB: AquaBounty Technologies

                      This fish growing stock has been trading inside the breakup candle from mid September with $3.80 being pretty strong support. I've got my stop loss at $3.00 so I'm willing to let this one run down a little. I think there are rough waters ahead for the overall market, so at $3.00, that seems like a reasonable level for me to get out. I think that this type of business will be very viable in the future as people are looking for ways to raise meat and meat type stuff. Once we get over the fake meat like things that are really just over processed plants, the public will look for more healthy alternatives and growing fish faster will be right up their alley. My only worry is that I'm about 2 years ahead of my time with this one.

                      TOTALS ALL STOCKS 2020 63,491.25 -10,151.25 -2,748.25 136.58
                      MONTH NOV IN 29,366.00 ALLOWED -3,271.00 GAIN SO 142.00 TOTAL 0.00
                      TOTALS PER STOCK AQB PLAY 3,138.50 LOSS -738.50 FAR 189.50 GAIN 0.00
                      MONTH NOV 0.00 0.00 0.00 0.00
                      STOCKS
                      DATE TIME STOCK
                      TICKER
                      SHARES BEGIN
                      BUY/SELL
                      PRICE
                      TOTAL
                      IN PLAY
                      SET
                      STOP LOSS
                      PRICE
                      ALLOWABLE
                      LOSS TOTAL
                      ALLOW
                      LOSS
                      % TOTAL
                      TODAY'S
                      CLOSE/END
                      PRICE
                      GAIN/LOSS
                      SO FAR
                      END
                      SHARES
                      END
                      BUY/SELL
                      PRICE
                      END
                      GAIN/LOSS
                      END
                      %
                      GAIN/LOSS
                      TOTAL
                      GAIN/LOSS
                      TOTAL
                      %
                      GAIN/LOSS
                      PARTIAL 1
                      SHARES
                      PARTIAL 1
                      BUY/SELL
                      PRICE
                      PARTIAL 1
                      GAIN/LOSS
                      PARTIAL 1
                      %
                      GAIN/LOSS
                      PARTIAL 2
                      SHARES
                      PARTIAL 2
                      BUY/SELL
                      PRICE
                      PARTIAL 2
                      GAIN/LOSS
                      PARTIAL 2
                      %
                      GAIN/LOSS
                      PARTIAL 3
                      SHARES
                      PARTIAL 3
                      BUY/SELL
                      PRICE
                      PARTIAL 3
                      GAIN/LOSS
                      PARTIAL 3
                      %
                      GAIN/LOSS
                      09/23/20 14.55.15 AQB 25 4.17 104.25 3.00 -29.25 -28.06% 4.16 -0.25
                      10/20/20 10.34.43 AQB 375 4.07 1,526.25 3.00 -401.25 -26.29% 4.16 33.75
                      10/28/20 9.54.34 AQB 400 3.77 1,508.00 3.00 -308.00 -20.42% 4.16 156.00
                      As you can see from my chart, I have a little more than 3 dimes on this one so I consider it my speculative stock at this point. If it can get above the breakup candle from September, I will probably add another 3 dimes to it.


                      A look at the weekly chart shows that once again the price bounced off of the $3.80 level and trading volume has been higher over the last month. Stochastics are flattening or even starting to rise with the Macd continuing to move north. The trend-o-meter (shown with the volume data) is still in a downtrend but this indicator does lag a few weeks, but it is starting to look flat as well.

                      If I'm wrong and the overall market see a Christmas rally this year as what usually happens, this stock may be able to capitalize and start moving north.

                      AU: Anglogold Ashanti LTD

                      This is a gold mining stock primarily but they do also sell silver, other metals and even sulfuric acid as a by product of their efforts to mine gold. The immediate and far futures are looking good for the entire sector. Gold prices at higher levels than ever historically will only fuel the profits of the mining stocks. Looking at the charts however will show a different story.


                      As you can see from the chart, I'm enduring some pain as the down trending channel just keeps moving along. Stochastics are oversold, the Macd is about as low as it gets, trading volume has been pretty steady for awhile now, and the Trend-o-meter is solidly in a down trend. Things look about as bleek as they have been in a while. This is the time I usually like to buy things, when they look as if nobody will ever want them again. I actually doubled my position this week as the chart shows. Later in the week as gold continued to go lower, I noticed that the mining stocks moved up. This is a divergence that hasn't happened in a while so maybe the bottom is starting to appear.

                      TOTALS ALL STOCKS 2020 63,491.25 -10,151.25 -2,748.25 136.58
                      MONTH NOV IN 29,366.00 ALLOWED -3,271.00 GAIN SO 142.00 TOTAL 0.00
                      TOTALS PER STOCK AU PLAY 9,519.00 LOSS -1,715.00 FAR -955.00 GAIN 1,763.98
                      MONTH NOV 4,168.00 -266.00 114.00 0.00
                      STOCKS
                      DATE TIME STOCK
                      TICKER
                      SHARES BEGIN
                      BUY/SELL
                      PRICE
                      TOTAL
                      IN PLAY
                      SET
                      STOP LOSS
                      PRICE
                      ALLOWABLE
                      LOSS TOTAL
                      ALLOW
                      LOSS
                      % TOTAL
                      TODAY'S
                      CLOSE/END
                      PRICE
                      GAIN/LOSS
                      SO FAR
                      END
                      SHARES
                      END
                      BUY/SELL
                      PRICE
                      END
                      GAIN/LOSS
                      END
                      %
                      GAIN/LOSS
                      TOTAL
                      GAIN/LOSS
                      TOTAL
                      %
                      GAIN/LOSS
                      PARTIAL 1
                      SHARES
                      PARTIAL 1
                      BUY/SELL
                      PRICE
                      PARTIAL 1
                      GAIN/LOSS
                      PARTIAL 1
                      %
                      GAIN/LOSS
                      PARTIAL 2
                      SHARES
                      PARTIAL 2
                      BUY/SELL
                      PRICE
                      PARTIAL 2
                      GAIN/LOSS
                      PARTIAL 2
                      %
                      GAIN/LOSS
                      PARTIAL 3
                      SHARES
                      PARTIAL 3
                      BUY/SELL
                      PRICE
                      PARTIAL 3
                      GAIN/LOSS
                      PARTIAL 3
                      %
                      GAIN/LOSS
                      09/02/20 11.27.15 AU 300 28.01 2,801.00 19.51 -850.00 -30.35% 21.41 -660.00 85 28.51 42.50 1.79% 115 28.57 64.40 2.00%
                      10/22/20 15.39.11 AU 100 25.50 2,550.00 19.51 -599.00 -23.49% 21.41 -409.00
                      11/24/20 14.15.24 AU 200 20.84 4,168.00 19.51 -266.00 -6.38% 21.41 114.00

                      GDX: Vaneck Vectors ETF Trust Gold Miners


                      This is a basket of gold mining stocks, and like AU, it too is in a down trending channel although not as steep as AU. The chart shows all of the negative stuff that the AU chart has is and are present with the GDX chart. So what did I do, yep you guessed it, I doubled my position with this one as well.


                      And he is the chart.

                      TOTALS ALL STOCKS 2020 63,491.25 -10,151.25 -2,748.25 136.58
                      MONTH NOV IN 29,366.00 ALLOWED -3,271.00 GAIN SO 142.00 TOTAL 0.00
                      TOTALS PER STOCK GDX PLAY 14,622.00 LOSS -3,438.00 FAR -930.00 GAIN 1,706.95
                      MONTH NOV 6,730.00 -1,138.00 116.00 0.00
                      STOCKS
                      DATE TIME STOCK
                      TICKER
                      SHARES BEGIN
                      BUY/SELL
                      PRICE
                      TOTAL
                      IN PLAY
                      SET
                      STOP LOSS
                      PRICE
                      ALLOWABLE
                      LOSS TOTAL
                      ALLOW
                      LOSS
                      % TOTAL
                      TODAY'S
                      CLOSE/END
                      PRICE
                      GAIN/LOSS
                      SO FAR
                      END
                      SHARES
                      END
                      BUY/SELL
                      PRICE
                      END
                      GAIN/LOSS
                      END
                      %
                      GAIN/LOSS
                      TOTAL
                      GAIN/LOSS
                      TOTAL
                      %
                      GAIN/LOSS
                      PARTIAL 1
                      SHARES
                      PARTIAL 1
                      BUY/SELL
                      PRICE
                      PARTIAL 1
                      GAIN/LOSS
                      PARTIAL 1
                      %
                      GAIN/LOSS
                      PARTIAL 2
                      SHARES
                      PARTIAL 2
                      BUY/SELL
                      PRICE
                      PARTIAL 2
                      GAIN/LOSS
                      PARTIAL 2
                      %
                      GAIN/LOSS
                      PARTIAL 3
                      SHARES
                      PARTIAL 3
                      BUY/SELL
                      PRICE
                      PARTIAL 3
                      GAIN/LOSS
                      PARTIAL 3
                      %
                      GAIN/LOSS
                      09/04/20 10.29.46 GDX 50 39.91 1,995.50 27.96 -597.50 -29.94% 34.23 -284.00
                      09/21/20 10.13.53 GDX 50 40.10 2,005.00 27.96 -607.00 -30.27% 34.23 -293.50
                      10/22/20 15.50.42 GDX 50 39.20 1,960.00 27.96 -562.00 -28.67% 34.23 -248.50
                      10/26/20 11.13.22 GDX 50 38.63 1,931.50 27.96 -533.50 -27.62% 34.23 -220.00
                      11/24/20 14.12.15 GDX 200 33.65 6,730.00 27.96 -1,138.00 -16.91% 34.23 116.00
                      The stop prices listed for all of these gold and gold miners are just bullshit, I'm not selling these at this point. If it goes down to the stop price listed, that just means I'll be buying more at that level.

                      GLD: SPDR Gold Trust ETF

                      Gold took a pretty sizable smack down this week, and in all probability there is more down side to come. It seems that the whole investment world is looking to better times ahead and it shows as equities are moving up and Kung Flu vaccines are entering the market. I'm here to say it is all bullshit. The economy has substantial challenges ahead, and I foresee some really rough times coming in the next year. Of course gold is taking a hit. Deflationary times with banks not lending to anyone for any reason is also not going to help. The world is pretty much at peace right now but I think that will start to end and trouble spots around the world will flare up. It's gonna be a rough immediate future for the gold hoarders but we shall have our day in the not too distance future. Cost average down and sit back and wait for the world to go to shit.


                      Look at that nasty break down candle that stopped right at the drawn in trend line. Volume didn't really help as it doesn't look like capitulation levels to me yet. Stochastics are still headed down toward the oversold area, and the MACD is about as low as it goes. The Trend-o-meter is doing its job telling me that we are in a down trending channel. So what do I do? Well the price dipped below $170 and I stated several weeks ago that I was a buyer at the $170 level so I doubled my position.

                      TOTALS ALL STOCKS 2020 63,491.25 -10,151.25 -2,748.25 136.58
                      MONTH NOV IN 29,366.00 ALLOWED -3,271.00 GAIN SO 142.00 TOTAL 0.00
                      TOTALS PER STOCK GLD PLAY 34,703.75 LOSS -4,001.75 FAR -1,145.75 GAIN 1,034.28
                      MONTH NOV 16,960.00 -1,609.00 -181.00 0.00
                      STOCKS
                      DATE TIME STOCK
                      TICKER
                      SHARES BEGIN
                      BUY/SELL
                      PRICE
                      TOTAL
                      IN PLAY
                      SET
                      STOP LOSS
                      PRICE
                      ALLOWABLE
                      LOSS TOTAL
                      ALLOW
                      LOSS
                      % TOTAL
                      TODAY'S
                      CLOSE/END
                      PRICE
                      GAIN/LOSS
                      SO FAR
                      END
                      SHARES
                      END
                      BUY/SELL
                      PRICE
                      END
                      GAIN/LOSS
                      END
                      %
                      GAIN/LOSS
                      TOTAL
                      GAIN/LOSS
                      TOTAL
                      %
                      GAIN/LOSS
                      PARTIAL 1
                      SHARES
                      PARTIAL 1
                      BUY/SELL
                      PRICE
                      PARTIAL 1
                      GAIN/LOSS
                      PARTIAL 1
                      %
                      GAIN/LOSS
                      PARTIAL 2
                      SHARES
                      PARTIAL 2
                      BUY/SELL
                      PRICE
                      PARTIAL 2
                      GAIN/LOSS
                      PARTIAL 2
                      %
                      GAIN/LOSS
                      PARTIAL 3
                      SHARES
                      PARTIAL 3
                      BUY/SELL
                      PRICE
                      PARTIAL 3
                      GAIN/LOSS
                      PARTIAL 3
                      %
                      GAIN/LOSS
                      09/21/20 10.24.51 GLD 100 178.25 13,368.75 153.51 -1,855.50 -13.88% 167.79 -784.50 25 180.63 59.50 1.34%
                      09/23/20 13.34.20 GLD 25 175.00 4,375.00 153.51 -537.25 -12.28% 167.79 -180.25
                      11/24/20 13.39.32 GLD 100 169.60 16,960.00 153.51 -1,609.00 -9.49% 167.79 -181.00

                      Just like with the gold miners, the stop loss doesn't mean shit here either, it just marks the spot where I will buy some more.

                      SPH: Suburban Propane Partners LP

                      This was my former bank account, but they recently reduced the dividend for this stock to a more sustainable level.


                      OK looking at the chart shows that the stock is maintaining a level. I'm a little worried about a stock that didn't make any money but still pays a dividend but I have it under good authority that this will be a dark winter which means it will also be cold so even though all of the macro shit I see says that oil prices will have a hard time rising, I'll hang onto this stock for the foreseeable future. The 2 down trending lines are a long term 10 year month chart look that is still intact.

                      TOTALS ALL STOCKS 2020 63,491.25 -10,151.25 -2,748.25 136.58
                      MONTH NOV IN 29,366.00 ALLOWED -3,271.00 GAIN SO 142.00 TOTAL 0.00
                      TOTALS PER STOCK SPH PLAY 1,508.00 LOSS -258.00 FAR 93.00 GAIN 110.00
                      MONTH NOV 1,508.00 -258.00 93.00 110.00
                      STOCKS
                      DATE TIME STOCK
                      TICKER
                      SHARES BEGIN
                      BUY/SELL
                      PRICE
                      TOTAL
                      IN PLAY
                      SET
                      STOP LOSS
                      PRICE
                      ALLOWABLE
                      LOSS TOTAL
                      ALLOW
                      LOSS
                      % TOTAL
                      TODAY'S
                      CLOSE/END
                      PRICE
                      GAIN/LOSS
                      SO FAR
                      END
                      SHARES
                      END
                      BUY/SELL
                      PRICE
                      END
                      GAIN/LOSS
                      END
                      %
                      GAIN/LOSS
                      TOTAL
                      GAIN/LOSS
                      TOTAL
                      %
                      GAIN/LOSS
                      PARTIAL 1
                      SHARES
                      PARTIAL 1
                      BUY/SELL
                      PRICE
                      PARTIAL 1
                      GAIN/LOSS
                      PARTIAL 1
                      %
                      GAIN/LOSS
                      PARTIAL 2
                      SHARES
                      PARTIAL 2
                      BUY/SELL
                      PRICE
                      PARTIAL 2
                      GAIN/LOSS
                      PARTIAL 2
                      %
                      GAIN/LOSS
                      PARTIAL 3
                      SHARES
                      PARTIAL 3
                      BUY/SELL
                      PRICE
                      PARTIAL 3
                      GAIN/LOSS
                      PARTIAL 3
                      %
                      GAIN/LOSS
                      11/04/20 15.01.46 SPH 100 15.08 1,508.00 12.50 -258.00 -17.11% 16.01 93.00
                      I've only parked $1500 in this stock so I'm not really worried that much about the movement right now but I like to have some shares so that it stays on my radar.


                      This week the scanner didn't pick up on anything so I won't be making any scanner picks going into the Christmas season so far. Next week will be a large tell for the rest of the year. I think we start to see some cracks in the bull run here and a pullback will emerge just in time for the holiday festival. The writing is on the wall with the pussy ass lefty states closing down again over the Turkey day celebration, and I didn't see anyone adhering to the rulings given by the states' Kings so that means that the Kung Flu will come back and scare the shyt out of the people who are inclined to care about a non-pandemic level rise in deaths because the pussification of the U.S. is in favor.

                      Be well and happy trading.
                      Last edited by Slurry Pumper; 11-29-20, 12:59 PM.
                      Comment
                      • RoyBacon
                        BARRELED IN @ SBR!
                        • 09-21-05
                        • 37074

                        #8236
                        Good to read your write-up on GLD. You laid out a bearish argument and then said you added under $170.

                        I wish I had an opinion worthy of a trade. I saw Goldman or some big house come out and say the rally is not over.

                        I kind of think we see more strength after GLD lays in recovery for a few weeks.
                        Comment
                        • Slurry Pumper
                          SBR MVP
                          • 06-18-18
                          • 2811

                          #8237
                          Originally posted by RoyBacon
                          Good to read your write-up on GLD. You laid out a bearish argument and then said you added under $170.

                          I wish I had an opinion worthy of a trade. I saw Goldman or some big house come out and say the rally is not over.

                          I kind of think we see more strength after GLD lays in recovery for a few weeks.
                          I know it doesn't seem right to be bearish on something and still sink 17 grand into it on the long side. I'm cost averaging down here and will do it again if I have to in the up coming months. I think gold will recover but it may take a while for the recovery. This last week may be enough to shake out all of the weaker trading hands. I'm in this for a long time and if you believe in something, now is the time to step in and buy. Right when everyone doesn't want it.

                          For all you bitcoin people, I hope you all took profits in the last week. Every time I think I want to go into the bitcoin trade, I see extreme volatility that makes me puss out.

                          As far as quick 1 to 2 week trades, I got nothing. I really think we are headed off of a cliff. Well a little cliff anyway. All of this bullishness will end, even in December. Actually I think we will get a sign by the end of this week.
                          Comment
                          • RoyBacon
                            BARRELED IN @ SBR!
                            • 09-21-05
                            • 37074

                            #8238
                            TSLA over $600

                            I'm going to nervously sell some calls. This could be a window dressing stock that funds want to show so may keep finding buyers.
                            Comment
                            • chico2663
                              BARRELED IN @ SBR!
                              • 09-02-10
                              • 36915

                              #8239
                              Originally posted by RoyBacon
                              TSLA over $600

                              I'm going to nervously sell some calls. This could be a window dressing stock that funds want to show so may keep finding buyers.
                              On way to at least 650 or 700. Up 500 on this sucker. Dec 14 will be interesting.
                              Comment
                              • RoyBacon
                                BARRELED IN @ SBR!
                                • 09-21-05
                                • 37074

                                #8240
                                Originally posted by chico2663
                                On way to at least 650 or 700. Up 500 on this sucker. Dec 14 will be interesting.
                                I'm sticking with $635 but it may prove me wrong. May get there today. LOL
                                Comment
                                • navyblue81
                                  SBR MVP
                                  • 11-29-13
                                  • 4143

                                  #8241
                                  Nice to wake up to see MARA already up 30% ☺️
                                  Comment
                                  • kaliboyz
                                    SBR MVP
                                    • 10-30-09
                                    • 3121

                                    #8242
                                    Originally posted by kaliboyz
                                    Anyone get in TSNP? Raise your hand.. This shit getting wild..

                                    I'm in 100,000 shares at .05 ... Up 100%
                                    penetrating beast
                                    Comment
                                    • chico2663
                                      BARRELED IN @ SBR!
                                      • 09-02-10
                                      • 36915

                                      #8243
                                      Bought l c a today. Not smart move.
                                      Comment
                                      • RoyBacon
                                        BARRELED IN @ SBR!
                                        • 09-21-05
                                        • 37074

                                        #8244
                                        We were due for a little ugliness.
                                        Comment
                                        • navyblue81
                                          SBR MVP
                                          • 11-29-13
                                          • 4143

                                          #8245
                                          Up 40% on my portfolio today. Been a good day.
                                          Comment
                                          • Madison
                                            SBR Hall of Famer
                                            • 09-16-11
                                            • 6411

                                            #8246
                                            I have Trailing stop loss % on most of my holdings. I've had a few winners but mostly seem to be losing. Today I had NVDA and DOCU stopped out and they both gained after the kick out. Anyone can direct me to information to strategic strategy's?
                                            Comment
                                            • Madison
                                              SBR Hall of Famer
                                              • 09-16-11
                                              • 6411

                                              #8247
                                              Originally posted by navyblue81
                                              Up 40% on my portfolio today. Been a good day.
                                              It would be great if you could let us know what your portfolio consists of and the total amount of it. If my portfolio is 1K and I'm up 40% I'm not so interested.

                                              My actively traded portfolio is circa 40-50K. I'm down $300 today. Unfortunately my stop loss strategy cost me on NVDA and DOCU.

                                              I know our strategies differ but clarity would help.
                                              Comment
                                              • rm18
                                                SBR Posting Legend
                                                • 09-20-05
                                                • 22291

                                                #8248
                                                That Babyf is doing well up like 7% every day. Seems like a good product with no competition. Most my other portfolio down today but still up.
                                                Comment
                                                • Slurry Pumper
                                                  SBR MVP
                                                  • 06-18-18
                                                  • 2811

                                                  #8249
                                                  Originally posted by Madison
                                                  I have Trailing stop loss % on most of my holdings. I've had a few winners but mostly seem to be losing. Today I had NVDA and DOCU stopped out and they both gained after the kick out. Anyone can direct me to information to strategic strategy's?
                                                  I don't know of a place to get strategic strategy awareness education although I'm sure there are allot of web sites out there to learn from. I typically like to use a break up or down candle to set my stop losses. I also use levels of support by placing my stop loss just under a level of support by a few cents, then place a stipulation on the sale that it doesn't happen unless the hourly close of that particular candle is below my stop loss price. This saves me about 80% of the time against fast spiking equities that have a daily moment of one way or the other. The other 20% however is price can go way down over the course of an hour and the other side of the coin is you will sell at an even lower cost that you thought you wanted to.

                                                  I would check to see where support is at about the amount you are willing to lose on a stock and place a stop loss there, then make what they call a OCO (One Cancels the Other) order and pick a profit that you would think is reasonable for a specified amount of time and maybe sell half a position at that level.

                                                  For instance, on my daily scalp and swing trades, I typically hop in on a stock, (lately its been UPRO and SPXU) at a predefined level. I have a minimum amount or percentage that I take a profit at. I set a OCO order to sell all at a stop price that I'm willing to lose for the trade, and the other side of that trade is a sale of half the position on a pre-targeted price level. If the price hits my stop loss, I'm all the way out, but if it hits my minimum profit target, I'm half way out. This way I can reset my stop loss right above my original entry point and set a trailing stop to let the rest run.
                                                  So where the break up or break down candle comes in is: Usually after a break up/down candle is put in, there will be some inside trading, so a break up candle runs up to a level then the price kind of hangs out for a little while not really going down or up but creating a bullish flag type of pattern. I get in and place a stop at the lower end or just under the low of the break up candle. The closer you are to the bottom of that candle when you enter, the lower your loss will be when the price breaks down below that candle if you're wrong. If you're right the price will gain energy and break out above the breakup candle again to run some more.
                                                  Comment
                                                  • navyblue81
                                                    SBR MVP
                                                    • 11-29-13
                                                    • 4143

                                                    #8250
                                                    Originally posted by Madison
                                                    It would be great if you could let us know what your portfolio consists of and the total amount of it. If my portfolio is 1K and I'm up 40% I'm not so interested.

                                                    My actively traded portfolio is circa 40-50K. I'm down $300 today. Unfortunately my stop loss strategy cost me on NVDA and DOCU.

                                                    I know our strategies differ but clarity would help.
                                                    I’ve stated my portfolio on here. MARA is why I had such a big day. That’s my short term play although I’ve had it for a week now. Also have AAPL and TTD long-term.
                                                    Comment
                                                    • Madison
                                                      SBR Hall of Famer
                                                      • 09-16-11
                                                      • 6411

                                                      #8251
                                                      Originally posted by Slurry Pumper
                                                      I don't know of a place to get strategic strategy awareness education although I'm sure there are allot of web sites out there to learn from. I typically like to use a break up or down candle to set my stop losses. I also use levels of support by placing my stop loss just under a level of support by a few cents, then place a stipulation on the sale that it doesn't happen unless the hourly close of that particular candle is below my stop loss price. This saves me about 80% of the time against fast spiking equities that have a daily moment of one way or the other. The other 20% however is price can go way down over the course of an hour and the other side of the coin is you will sell at an even lower cost that you thought you wanted to.

                                                      I would check to see where support is at about the amount you are willing to lose on a stock and place a stop loss there, then make what they call a OCO (One Cancels the Other) order and pick a profit that you would think is reasonable for a specified amount of time and maybe sell half a position at that level.

                                                      For instance, on my daily scalp and swing trades, I typically hop in on a stock, (lately its been UPRO and SPXU) at a predefined level. I have a minimum amount or percentage that I take a profit at. I set a OCO order to sell all at a stop price that I'm willing to lose for the trade, and the other side of that trade is a sale of half the position on a pre-targeted price level. If the price hits my stop loss, I'm all the way out, but if it hits my minimum profit target, I'm half way out. This way I can reset my stop loss right above my original entry point and set a trailing stop to let the rest run.
                                                      So where the break up or break down candle comes in is: Usually after a break up/down candle is put in, there will be some inside trading, so a break up candle runs up to a level then the price kind of hangs out for a little while not really going down or up but creating a bullish flag type of pattern. I get in and place a stop at the lower end or just under the low of the break up candle. The closer you are to the bottom of that candle when you enter, the lower your loss will be when the price breaks down below that candle if you're wrong. If you're right the price will gain energy and break out above the breakup candle again to run some more.
                                                      I can't thank you enough for your help, however you are way over my head with the technicals.

                                                      All my best,
                                                      Comment
                                                      • Madison
                                                        SBR Hall of Famer
                                                        • 09-16-11
                                                        • 6411

                                                        #8252
                                                        Originally posted by navyblue81
                                                        I’ve stated my portfolio on here. MARA is why I had such a big day. That’s my short term play although I’ve had it for a week now. Also have AAPL and TTD long-term.
                                                        .

                                                        I peeked at MARA today. Seems like the ship has sailed??
                                                        Comment
                                                        • slewfan
                                                          SBR Posting Legend
                                                          • 10-01-15
                                                          • 15787

                                                          #8253
                                                          Bought COCP today. NTLA has been spectacular.
                                                          Comment
                                                          • navyblue81
                                                            SBR MVP
                                                            • 11-29-13
                                                            • 4143

                                                            #8254
                                                            Originally posted by Madison
                                                            .

                                                            I peeked at MARA today. Seems like the ship has sailed??
                                                            Went up almost 50% today. I think it’s still sailing, at least I hope so haha.
                                                            Bitcoin just a train that keeps picking up speed.

                                                            I hate playing med stocks, but you have to wonder if Moderna is going to go through the roof here the next few weeks.
                                                            Comment
                                                            • Snowball
                                                              BARRELED IN @ SBR!
                                                              • 11-15-09
                                                              • 30042

                                                              #8255
                                                              BTZI MARA
                                                              RIOT NPPTF
                                                              BTCS XNET
                                                              HVBTF FINV CDE
                                                              HUTMF BKLLF HL
                                                              DTMXF FGNA warrants
                                                              BBKCF SNSFF BTBT
                                                              DOFSQ VKIN SB
                                                              short LB
                                                              Comment
                                                              • navyblue81
                                                                SBR MVP
                                                                • 11-29-13
                                                                • 4143

                                                                #8256
                                                                I put my $10k into my kid’s college fund 8 months ago into TTD. Just checked it this morning. It’s now $23k!

                                                                God I love TTD. Been one of the best decisions I made.
                                                                Comment
                                                                • chico2663
                                                                  BARRELED IN @ SBR!
                                                                  • 09-02-10
                                                                  • 36915

                                                                  #8257
                                                                  roy check out aiv
                                                                  Comment
                                                                  • RoyBacon
                                                                    BARRELED IN @ SBR!
                                                                    • 09-21-05
                                                                    • 37074

                                                                    #8258
                                                                    Originally posted by chico2663
                                                                    roy check out aiv

                                                                    Yeaaaaaaaaaa.

                                                                    I'm not ready for this group yet.


                                                                    Today's Top 10 Performing Equity Real Estate Investment Trusts (REITs) Stocks

                                                                    • as of 10:22 AM ET 12/01/2020
                                                                    • Refresh

                                                                    SKT
                                                                    Common Stock (REIT) +6.35% Neutral (6.5)
                                                                    CXW Common Stock (REIT) +6.06% Bearish (1.3)
                                                                    WPG

                                                                    Common Stock (REIT) +5.88% N/A
                                                                    AFIN Common Stock +5.56% Bearish (1.3)
                                                                    SRG

                                                                    Common Stock (REIT) +5.55% N/A
                                                                    XHR

                                                                    Common Stock (REIT) +5.54% Very Bearish (0.7)
                                                                    WSR Common Stock (REIT) +5.28% Bearish (2.6)
                                                                    RLJ
                                                                    Common Stock (REIT) +5.27% Very Bearish (0.1)
                                                                    SVC Common Stock (REIT) +4.47% Very Bearish (0.5)
                                                                    CIO
                                                                    Common Stock (REIT) +4.45% Bearish (1.8)

                                                                    I've built some spots in AGNC, NLY and your old buddy NRZ. I like the mortgage paper mills.

                                                                    But not ready to buy the brick and mortar stuff just yet.
                                                                    Comment
                                                                    • Madison
                                                                      SBR Hall of Famer
                                                                      • 09-16-11
                                                                      • 6411

                                                                      #8259
                                                                      Originally posted by Slurry Pumper
                                                                      Ok I was out playing around last week so I didn't post how my long term positions are doing. The market continues to drift up and I think the greed index is now over 90% bullish which alone is enough for me to say we are heading for a downturn in the market. Of course even after the buys this week, I'm staying mostly on the sidelines playing the UPRO and SPXU with scalp and swing trades. I did substantially increase most of my positions so lets get right to it.

                                                                      AQB: AquaBounty Technologies

                                                                      This fish growing stock has been trading inside the breakup candle from mid September with $3.80 being pretty strong support. I've got my stop loss at $3.00 so I'm willing to let this one run down a little. I think there are rough waters ahead for the overall market, so at $3.00, that seems like a reasonable level for me to get out. I think that this type of business will be very viable in the future as people are looking for ways to raise meat and meat type stuff. Once we get over the fake meat like things that are really just over processed plants, the public will look for more healthy alternatives and growing fish faster will be right up their alley. My only worry is that I'm about 2 years ahead of my time with this one.

                                                                      TOTALS ALL STOCKS 2020 63,491.25 -10,151.25 -2,748.25 136.58
                                                                      MONTH NOV IN 29,366.00 ALLOWED -3,271.00 GAIN SO 142.00 TOTAL 0.00
                                                                      TOTALS PER STOCK AQB PLAY 3,138.50 LOSS -738.50 FAR 189.50 GAIN 0.00
                                                                      MONTH NOV 0.00 0.00 0.00 0.00
                                                                      STOCKS
                                                                      DATE TIME STOCK
                                                                      TICKER
                                                                      SHARES BEGIN
                                                                      BUY/SELL
                                                                      PRICE
                                                                      TOTAL
                                                                      IN PLAY
                                                                      SET
                                                                      STOP LOSS
                                                                      PRICE
                                                                      ALLOWABLE
                                                                      LOSS TOTAL
                                                                      ALLOW
                                                                      LOSS
                                                                      % TOTAL
                                                                      TODAY'S
                                                                      CLOSE/END
                                                                      PRICE
                                                                      GAIN/LOSS
                                                                      SO FAR
                                                                      END
                                                                      SHARES
                                                                      END
                                                                      BUY/SELL
                                                                      PRICE
                                                                      END
                                                                      GAIN/LOSS
                                                                      END
                                                                      %
                                                                      GAIN/LOSS
                                                                      TOTAL
                                                                      GAIN/LOSS
                                                                      TOTAL
                                                                      %
                                                                      GAIN/LOSS
                                                                      PARTIAL 1
                                                                      SHARES
                                                                      PARTIAL 1
                                                                      BUY/SELL
                                                                      PRICE
                                                                      PARTIAL 1
                                                                      GAIN/LOSS
                                                                      PARTIAL 1
                                                                      %
                                                                      GAIN/LOSS
                                                                      PARTIAL 2
                                                                      SHARES
                                                                      PARTIAL 2
                                                                      BUY/SELL
                                                                      PRICE
                                                                      PARTIAL 2
                                                                      GAIN/LOSS
                                                                      PARTIAL 2
                                                                      %
                                                                      GAIN/LOSS
                                                                      PARTIAL 3
                                                                      SHARES
                                                                      PARTIAL 3
                                                                      BUY/SELL
                                                                      PRICE
                                                                      PARTIAL 3
                                                                      GAIN/LOSS
                                                                      PARTIAL 3
                                                                      %
                                                                      GAIN/LOSS
                                                                      09/23/20 14.55.15 AQB 25 4.17 104.25 3.00 -29.25 -28.06% 4.16 -0.25
                                                                      10/20/20 10.34.43 AQB 375 4.07 1,526.25 3.00 -401.25 -26.29% 4.16 33.75
                                                                      10/28/20 9.54.34 AQB 400 3.77 1,508.00 3.00 -308.00 -20.42% 4.16 156.00
                                                                      As you can see from my chart, I have a little more than 3 dimes on this one so I consider it my speculative stock at this point. If it can get above the breakup candle from September, I will probably add another 3 dimes to it.


                                                                      A look at the weekly chart shows that once again the price bounced off of the $3.80 level and trading volume has been higher over the last month. Stochastics are flattening or even starting to rise with the Macd continuing to move north. The trend-o-meter (shown with the volume data) is still in a downtrend but this indicator does lag a few weeks, but it is starting to look flat as well.

                                                                      If I'm wrong and the overall market see a Christmas rally this year as what usually happens, this stock may be able to capitalize and start moving north.

                                                                      AU: Anglogold Ashanti LTD

                                                                      This is a gold mining stock primarily but they do also sell silver, other metals and even sulfuric acid as a by product of their efforts to mine gold. The immediate and far futures are looking good for the entire sector. Gold prices at higher levels than ever historically will only fuel the profits of the mining stocks. Looking at the charts however will show a different story.


                                                                      As you can see from the chart, I'm enduring some pain as the down trending channel just keeps moving along. Stochastics are oversold, the Macd is about as low as it gets, trading volume has been pretty steady for awhile now, and the Trend-o-meter is solidly in a down trend. Things look about as bleek as they have been in a while. This is the time I usually like to buy things, when they look as if nobody will ever want them again. I actually doubled my position this week as the chart shows. Later in the week as gold continued to go lower, I noticed that the mining stocks moved up. This is a divergence that hasn't happened in a while so maybe the bottom is starting to appear.

                                                                      TOTALS ALL STOCKS 2020 63,491.25 -10,151.25 -2,748.25 136.58
                                                                      MONTH NOV IN 29,366.00 ALLOWED -3,271.00 GAIN SO 142.00 TOTAL 0.00
                                                                      TOTALS PER STOCK AU PLAY 9,519.00 LOSS -1,715.00 FAR -955.00 GAIN 1,763.98
                                                                      MONTH NOV 4,168.00 -266.00 114.00 0.00
                                                                      STOCKS
                                                                      DATE TIME STOCK
                                                                      TICKER
                                                                      SHARES BEGIN
                                                                      BUY/SELL
                                                                      PRICE
                                                                      TOTAL
                                                                      IN PLAY
                                                                      SET
                                                                      STOP LOSS
                                                                      PRICE
                                                                      ALLOWABLE
                                                                      LOSS TOTAL
                                                                      ALLOW
                                                                      LOSS
                                                                      % TOTAL
                                                                      TODAY'S
                                                                      CLOSE/END
                                                                      PRICE
                                                                      GAIN/LOSS
                                                                      SO FAR
                                                                      END
                                                                      SHARES
                                                                      END
                                                                      BUY/SELL
                                                                      PRICE
                                                                      END
                                                                      GAIN/LOSS
                                                                      END
                                                                      %
                                                                      GAIN/LOSS
                                                                      TOTAL
                                                                      GAIN/LOSS
                                                                      TOTAL
                                                                      %
                                                                      GAIN/LOSS
                                                                      PARTIAL 1
                                                                      SHARES
                                                                      PARTIAL 1
                                                                      BUY/SELL
                                                                      PRICE
                                                                      PARTIAL 1
                                                                      GAIN/LOSS
                                                                      PARTIAL 1
                                                                      %
                                                                      GAIN/LOSS
                                                                      PARTIAL 2
                                                                      SHARES
                                                                      PARTIAL 2
                                                                      BUY/SELL
                                                                      PRICE
                                                                      PARTIAL 2
                                                                      GAIN/LOSS
                                                                      PARTIAL 2
                                                                      %
                                                                      GAIN/LOSS
                                                                      PARTIAL 3
                                                                      SHARES
                                                                      PARTIAL 3
                                                                      BUY/SELL
                                                                      PRICE
                                                                      PARTIAL 3
                                                                      GAIN/LOSS
                                                                      PARTIAL 3
                                                                      %
                                                                      GAIN/LOSS
                                                                      09/02/20 11.27.15 AU 300 28.01 2,801.00 19.51 -850.00 -30.35% 21.41 -660.00 85 28.51 42.50 1.79% 115 28.57 64.40 2.00%
                                                                      10/22/20 15.39.11 AU 100 25.50 2,550.00 19.51 -599.00 -23.49% 21.41 -409.00
                                                                      11/24/20 14.15.24 AU 200 20.84 4,168.00 19.51 -266.00 -6.38% 21.41 114.00

                                                                      GDX: Vaneck Vectors ETF Trust Gold Miners


                                                                      This is a basket of gold mining stocks, and like AU, it too is in a down trending channel although not as steep as AU. The chart shows all of the negative stuff that the AU chart has is and are present with the GDX chart. So what did I do, yep you guessed it, I doubled my position with this one as well.


                                                                      And he is the chart.

                                                                      TOTALS ALL STOCKS 2020 63,491.25 -10,151.25 -2,748.25 136.58
                                                                      MONTH NOV IN 29,366.00 ALLOWED -3,271.00 GAIN SO 142.00 TOTAL 0.00
                                                                      TOTALS PER STOCK GDX PLAY 14,622.00 LOSS -3,438.00 FAR -930.00 GAIN 1,706.95
                                                                      MONTH NOV 6,730.00 -1,138.00 116.00 0.00
                                                                      STOCKS
                                                                      DATE TIME STOCK
                                                                      TICKER
                                                                      SHARES BEGIN
                                                                      BUY/SELL
                                                                      PRICE
                                                                      TOTAL
                                                                      IN PLAY
                                                                      SET
                                                                      STOP LOSS
                                                                      PRICE
                                                                      ALLOWABLE
                                                                      LOSS TOTAL
                                                                      ALLOW
                                                                      LOSS
                                                                      % TOTAL
                                                                      TODAY'S
                                                                      CLOSE/END
                                                                      PRICE
                                                                      GAIN/LOSS
                                                                      SO FAR
                                                                      END
                                                                      SHARES
                                                                      END
                                                                      BUY/SELL
                                                                      PRICE
                                                                      END
                                                                      GAIN/LOSS
                                                                      END
                                                                      %
                                                                      GAIN/LOSS
                                                                      TOTAL
                                                                      GAIN/LOSS
                                                                      TOTAL
                                                                      %
                                                                      GAIN/LOSS
                                                                      PARTIAL 1
                                                                      SHARES
                                                                      PARTIAL 1
                                                                      BUY/SELL
                                                                      PRICE
                                                                      PARTIAL 1
                                                                      GAIN/LOSS
                                                                      PARTIAL 1
                                                                      %
                                                                      GAIN/LOSS
                                                                      PARTIAL 2
                                                                      SHARES
                                                                      PARTIAL 2
                                                                      BUY/SELL
                                                                      PRICE
                                                                      PARTIAL 2
                                                                      GAIN/LOSS
                                                                      PARTIAL 2
                                                                      %
                                                                      GAIN/LOSS
                                                                      PARTIAL 3
                                                                      SHARES
                                                                      PARTIAL 3
                                                                      BUY/SELL
                                                                      PRICE
                                                                      PARTIAL 3
                                                                      GAIN/LOSS
                                                                      PARTIAL 3
                                                                      %
                                                                      GAIN/LOSS
                                                                      09/04/20 10.29.46 GDX 50 39.91 1,995.50 27.96 -597.50 -29.94% 34.23 -284.00
                                                                      09/21/20 10.13.53 GDX 50 40.10 2,005.00 27.96 -607.00 -30.27% 34.23 -293.50
                                                                      10/22/20 15.50.42 GDX 50 39.20 1,960.00 27.96 -562.00 -28.67% 34.23 -248.50
                                                                      10/26/20 11.13.22 GDX 50 38.63 1,931.50 27.96 -533.50 -27.62% 34.23 -220.00
                                                                      11/24/20 14.12.15 GDX 200 33.65 6,730.00 27.96 -1,138.00 -16.91% 34.23 116.00
                                                                      The stop prices listed for all of these gold and gold miners are just bullshit, I'm not selling these at this point. If it goes down to the stop price listed, that just means I'll be buying more at that level.

                                                                      GLD: SPDR Gold Trust ETF

                                                                      Gold took a pretty sizable smack down this week, and in all probability there is more down side to come. It seems that the whole investment world is looking to better times ahead and it shows as equities are moving up and Kung Flu vaccines are entering the market. I'm here to say it is all bullshit. The economy has substantial challenges ahead, and I foresee some really rough times coming in the next year. Of course gold is taking a hit. Deflationary times with banks not lending to anyone for any reason is also not going to help. The world is pretty much at peace right now but I think that will start to end and trouble spots around the world will flare up. It's gonna be a rough immediate future for the gold hoarders but we shall have our day in the not too distance future. Cost average down and sit back and wait for the world to go to shit.


                                                                      Look at that nasty break down candle that stopped right at the drawn in trend line. Volume didn't really help as it doesn't look like capitulation levels to me yet. Stochastics are still headed down toward the oversold area, and the MACD is about as low as it goes. The Trend-o-meter is doing its job telling me that we are in a down trending channel. So what do I do? Well the price dipped below $170 and I stated several weeks ago that I was a buyer at the $170 level so I doubled my position.

                                                                      TOTALS ALL STOCKS 2020 63,491.25 -10,151.25 -2,748.25 136.58
                                                                      MONTH NOV IN 29,366.00 ALLOWED -3,271.00 GAIN SO 142.00 TOTAL 0.00
                                                                      TOTALS PER STOCK GLD PLAY 34,703.75 LOSS -4,001.75 FAR -1,145.75 GAIN 1,034.28
                                                                      MONTH NOV 16,960.00 -1,609.00 -181.00 0.00
                                                                      STOCKS
                                                                      DATE TIME STOCK
                                                                      TICKER
                                                                      SHARES BEGIN
                                                                      BUY/SELL
                                                                      PRICE
                                                                      TOTAL
                                                                      IN PLAY
                                                                      SET
                                                                      STOP LOSS
                                                                      PRICE
                                                                      ALLOWABLE
                                                                      LOSS TOTAL
                                                                      ALLOW
                                                                      LOSS
                                                                      % TOTAL
                                                                      TODAY'S
                                                                      CLOSE/END
                                                                      PRICE
                                                                      GAIN/LOSS
                                                                      SO FAR
                                                                      END
                                                                      SHARES
                                                                      END
                                                                      BUY/SELL
                                                                      PRICE
                                                                      END
                                                                      GAIN/LOSS
                                                                      END
                                                                      %
                                                                      GAIN/LOSS
                                                                      TOTAL
                                                                      GAIN/LOSS
                                                                      TOTAL
                                                                      %
                                                                      GAIN/LOSS
                                                                      PARTIAL 1
                                                                      SHARES
                                                                      PARTIAL 1
                                                                      BUY/SELL
                                                                      PRICE
                                                                      PARTIAL 1
                                                                      GAIN/LOSS
                                                                      PARTIAL 1
                                                                      %
                                                                      GAIN/LOSS
                                                                      PARTIAL 2
                                                                      SHARES
                                                                      PARTIAL 2
                                                                      BUY/SELL
                                                                      PRICE
                                                                      PARTIAL 2
                                                                      GAIN/LOSS
                                                                      PARTIAL 2
                                                                      %
                                                                      GAIN/LOSS
                                                                      PARTIAL 3
                                                                      SHARES
                                                                      PARTIAL 3
                                                                      BUY/SELL
                                                                      PRICE
                                                                      PARTIAL 3
                                                                      GAIN/LOSS
                                                                      PARTIAL 3
                                                                      %
                                                                      GAIN/LOSS
                                                                      09/21/20 10.24.51 GLD 100 178.25 13,368.75 153.51 -1,855.50 -13.88% 167.79 -784.50 25 180.63 59.50 1.34%
                                                                      09/23/20 13.34.20 GLD 25 175.00 4,375.00 153.51 -537.25 -12.28% 167.79 -180.25
                                                                      11/24/20 13.39.32 GLD 100 169.60 16,960.00 153.51 -1,609.00 -9.49% 167.79 -181.00

                                                                      Just like with the gold miners, the stop loss doesn't mean shit here either, it just marks the spot where I will buy some more.

                                                                      SPH: Suburban Propane Partners LP

                                                                      This was my former bank account, but they recently reduced the dividend for this stock to a more sustainable level.


                                                                      OK looking at the chart shows that the stock is maintaining a level. I'm a little worried about a stock that didn't make any money but still pays a dividend but I have it under good authority that this will be a dark winter which means it will also be cold so even though all of the macro shit I see says that oil prices will have a hard time rising, I'll hang onto this stock for the foreseeable future. The 2 down trending lines are a long term 10 year month chart look that is still intact.

                                                                      TOTALS ALL STOCKS 2020 63,491.25 -10,151.25 -2,748.25 136.58
                                                                      MONTH NOV IN 29,366.00 ALLOWED -3,271.00 GAIN SO 142.00 TOTAL 0.00
                                                                      TOTALS PER STOCK SPH PLAY 1,508.00 LOSS -258.00 FAR 93.00 GAIN 110.00
                                                                      MONTH NOV 1,508.00 -258.00 93.00 110.00
                                                                      STOCKS
                                                                      DATE TIME STOCK
                                                                      TICKER
                                                                      SHARES BEGIN
                                                                      BUY/SELL
                                                                      PRICE
                                                                      TOTAL
                                                                      IN PLAY
                                                                      SET
                                                                      STOP LOSS
                                                                      PRICE
                                                                      ALLOWABLE
                                                                      LOSS TOTAL
                                                                      ALLOW
                                                                      LOSS
                                                                      % TOTAL
                                                                      TODAY'S
                                                                      CLOSE/END
                                                                      PRICE
                                                                      GAIN/LOSS
                                                                      SO FAR
                                                                      END
                                                                      SHARES
                                                                      END
                                                                      BUY/SELL
                                                                      PRICE
                                                                      END
                                                                      GAIN/LOSS
                                                                      END
                                                                      %
                                                                      GAIN/LOSS
                                                                      TOTAL
                                                                      GAIN/LOSS
                                                                      TOTAL
                                                                      %
                                                                      GAIN/LOSS
                                                                      PARTIAL 1
                                                                      SHARES
                                                                      PARTIAL 1
                                                                      BUY/SELL
                                                                      PRICE
                                                                      PARTIAL 1
                                                                      GAIN/LOSS
                                                                      PARTIAL 1
                                                                      %
                                                                      GAIN/LOSS
                                                                      PARTIAL 2
                                                                      SHARES
                                                                      PARTIAL 2
                                                                      BUY/SELL
                                                                      PRICE
                                                                      PARTIAL 2
                                                                      GAIN/LOSS
                                                                      PARTIAL 2
                                                                      %
                                                                      GAIN/LOSS
                                                                      PARTIAL 3
                                                                      SHARES
                                                                      PARTIAL 3
                                                                      BUY/SELL
                                                                      PRICE
                                                                      PARTIAL 3
                                                                      GAIN/LOSS
                                                                      PARTIAL 3
                                                                      %
                                                                      GAIN/LOSS
                                                                      11/04/20 15.01.46 SPH 100 15.08 1,508.00 12.50 -258.00 -17.11% 16.01 93.00
                                                                      I've only parked $1500 in this stock so I'm not really worried that much about the movement right now but I like to have some shares so that it stays on my radar.


                                                                      This week the scanner didn't pick up on anything so I won't be making any scanner picks going into the Christmas season so far. Next week will be a large tell for the rest of the year. I think we start to see some cracks in the bull run here and a pullback will emerge just in time for the holiday festival. The writing is on the wall with the pussy ass lefty states closing down again over the Turkey day celebration, and I didn't see anyone adhering to the rulings given by the states' Kings so that means that the Kung Flu will come back and scare the shyt out of the people who are inclined to care about a non-pandemic level rise in deaths because the pussification of the U.S. is in favor.

                                                                      Be well and happy trading.
                                                                      Slurry, been watching Gold for 40 years. Wondering if now is the time to make it part of my portfolio? Do you think GLD is a good place to dip me my toes?
                                                                      Comment
                                                                      • Madison
                                                                        SBR Hall of Famer
                                                                        • 09-16-11
                                                                        • 6411

                                                                        #8260
                                                                        Originally posted by navyblue81
                                                                        Went up almost 50% today. I think it’s still sailing, at least I hope so haha.
                                                                        Bitcoin just a train that keeps picking up speed.

                                                                        I hate playing med stocks, but you have to wonder if Moderna is going to go through the roof here the next few weeks.
                                                                        Hey, you are way more of a trader than I. I've been in XBI (ETF) as I'm not smart enough to pick one particular biotech and absorb the fluctuations. Not going to the moon but seems a pretty safe place to be.
                                                                        Comment
                                                                        SBR Contests
                                                                        Collapse
                                                                        Top-Rated US Sportsbooks
                                                                        Collapse
                                                                        Working...