-
-
-
-

TB is too general of a term. Have you experimented with Base Runs? More data is required, but it's a much more stable approach.
-

Originally Posted by
ScreaminPain

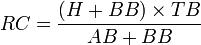
Yes, Runs Created can be used for batters and teams, but is there a way to use TB's vs. AB or IP to estimate the amount of runs a pitcher will give up?
I'm thinking any correlation may be vague at best.....

TB vs AB would simply be OpSLG for a pitcher and RC could also be used to figure the RC of batters vs a pitcher using the data a batters he's faced.
-
Originally Posted by
suicidekings
TB is too general of a term. Have you experimented with Base Runs? More data is required, but it's a much more stable approach.
Yes, I use Base Runs for my model and I agree it is the preferable for predictive purposes.
Ok, here is what I have so far...attempting to use Total Bases (TB's) as a predictive value. I used the "Last 3 games" value for each pitcher in a matchup, subtracting the TB's from the Innings pitched (IP). I then used an arbitrary differential of + or - 9 to separate one from another. I then filtered only teams whose last 7 gm batting avg, was higher than their season avg. I then filtered the bullpen ranking, stating the selected team must have a ranking higher than their opponent. So, to capsulize:
1. Pitchers TB's to IP ratio must be better than opponent by at least 9
2. Bullpen ranking must be higher than opponents ranking
3. Last 7 BA must be higher than overall season Avg.
What you end up with is a snapshot of a better starting pitcher, better team bullpen and a team thats hitting better, at present, than their overall average.
In August there have been only 6 plays, using the above stated criteria....resulting in a record of 6-2, with an average lay of -146. Promising, but not earth shaking, especially with so few plays.
I'm currently going thru July's games using the same set of data and filters. We'll see how that comes out.
Last edited by ScreaminPain; 08-10-11 at 12:15 PM.
-
you need more data than that.
-
Originally Posted by
ScreaminPain
Yes, I use Base Runs for my model and I agree it is the preferable for predictive purposes.
Ok, here is what I have so far...attempting to use Total Bases (TB's) as a predictive value. I used the "Last 3 games" value for each pitcher in a matchup, subtracting the TB's from the Innings pitched (IP). I then used an arbitrary differential of + or - 9 to separate one from another. I then filtered only teams whose last 7 gm batting avg, was higher than their season avg. I then filtered the bullpen ranking, stating the selected team must have a ranking higher than their opponent. So, to capsulize:
1. Pitchers TB's to IP ratio must be better than opponent by at least 9
2. Bullpen ranking must be higher than opponents ranking
3. Last 7 BA must be higher than overall season Avg.
What you end up with is a snapshot of a better starting pitcher, better team bullpen and a team thats hitting better, at present, than their overall average.
In August there have been only 6 plays, using the above stated criteria....resulting in a record of 6-2, with an average lay of -146. Promising, but not earth shaking, especially with so few plays.
I'm currently going thru July's games using the same set of data and filters. We'll see how that comes out.
Do you have your formula in an Excel spreadsheet so we can back test and would you be willing to share with us.
Thanks
-
Originally Posted by
Formulawiz
Do you have your formula in an Excel spreadsheet so we can back test and would you be willing to share with us.
Thanks
Yes!....busy this a.m., but I'll try to post later today...
I misstated the Aug. figures. I recapped and found the total amount of plays to be 14. There were 11 wins and 3 losses, with an average lay of -146.
Seeing that one is identifying the better matchup using 3 factors its understandable that the odds will probably be higher........Four of Aug plays were at odds exceeding -190 
I"m hoping for better results for July as it will have considerably more plays and therefore a more accurate assesment.....
Last edited by ScreaminPain; 08-13-11 at 12:45 PM.
-
try using the zips rest of season projects on fangraphs.
-
Here is what Ive been doing in an attempt to quantify a predictive relationship using a pitchers TBs allowed, Bullpen Ranking and teams recent batting stats. It would seem appropriate to assume that the fewer TBs allowed would yield a lower opponents score, plus having a better Bullpen ranking and more recent batting advantage, could lead to a favorable predictive relationship. This method should identify a streaking team, with the better starter and better Bullpen. Now the question is, will it make any difference from a wagering point of view?
Ive audited Julys results as it applies to this data. The method produced 21 Wins and 15 losses at an avg. lay of -142
..pretty much a push as a wagering opportunity. However, when looking at the losses, 6 losses were to teams whose 7-day batting avg. was higher than the otherwise selected team. When filtering out those teams, the record went to 19-9 for a total win of 6.4 units.
Obviously, this is STILL a work in progress. Im going to keep looking at it. Ive listed some data below, if anyone wants a crack at it. The formulas I used are included. Anyone can make a spreadsheet using the data Ive mentioned and work on your own filters.
The site Ive used to download the data is listed below.
http://www.cleanuphitter.com/mlb/stats/individual_pitcher_stats.php?numgames=3&stattype=TOTALS&seasononly=TRUE&pitchingrole=SP&submitform=GET+STATS
Teams and related data are listed on Row 4 and Row 5 of my spreadsheet.
My formula to identify if one pitcher has an advantage of 9 over his opponent is here:
IF(ISNA(AF5),"",IF(AND(((AH5-AF5)-(AH4-AF4))>9),"*",""))
Where: AF=Total Bases (TB)
AH=Innings Pitched (IP)
If difference is 9 or greater, an * will be entered in cell AM
My formula to identify if:
1) one pitchers difference between TBs and IP and his opponent is >9 denoted by *, in cell AM .
2) the Bullpen ranking is better than their opponents.
3) Teams last 7 day batting average is greater than their overall season avg.
IF(ISNA(AM4),"",IF(AND(AM4="*",AL4AN4),"PLAY"
Where: AM= the result of the first formula. (it will produce a * if true, and nothing if false)
AL= Bullpen RANKING* (*- I use a proprietary ranking system, but there are several available)
AN= Team batting avg. (BA) for the season
AZ= Team batting avg. LAST 7 Gms.


 Reply With Quote