-
 Getting from (golf) raw data to rating to prediction %
Hi,
I've been spending some time on compiling a database over past results (US and European tours since 1995), Betfair historical data (all tournaments/markets the last two years to start with = ~12000 bets/month on average) as well as retrieving current odds via Betfair free API. Now I need to start working on actually doing something with all this data 
So I have two requests:
1)
I'm looking for help and/or resources on how to creating a model for, I guess, normalizing different types of data so it can be compared player vs player. The result would be some sort of power rating.
(something like the Sagarin index http://www.golfweekrankings.com/temp...lt.asp?t=world which I guess I would rip if it had been published in its total, which AFAIK it hasn't)
I have this (partial) example mockup data:
Player 1
Avg scoring 69.3
Putting GIR 1.73
Top 10s 2
Player 2
Avg scoring 68.5
Putting GIR 1.81
Top 10s 4
Player 3
Avg scoring 71.5
Putting GIR 1.89
Top 10s 0
I've made a rough outline in Excel of a starting point on the weight of each data type (adjusted average scoring, driving total, course form etc iterated over categories all/last30/last10/last3/last). But how is the model/math from going from above data to:
Player 1
Rating 91/100
Player 2
Rating 93/100
Player 2
Rating 86/100
2)
Given that you have this rating, the next step is to translate this into probabilities. So how do I get from 91 vs. 93 rating to 65%/35% win probabilities in a head to head situation. (or in another case, 50 players ratings into outright win probabilities)
With this I intend to create a system for running the model many times, with different weight parameters, against historical odds and results to see if I could've found value in the past. If so I should be able to find +EV spots in the future (I hope) If not, at least I learned a ton of Office, C#, SOAP, SQL Server and LINQ programming
Any help on these matters would be appreciated.
//pompano
-
You need to read up on statistics, regression analysis, and distributions. I can guarantee you that nobody will help you build your model. But with enough research, you will find the methods for accomplishing that very mission.
-
Another thing you need - for each score, you need a course difficulty. Instead of using raw scores for each player, I'd use a "handicap versus course difficulty".
So if a course has an average of 69 for the top 100 players, and a player hit a 68 on it, I'd record a "-1" for that player at that course. The 68 number is almost worthless.
If you collect the data and are willing to spend time developing this model, I'll be happy to work with you.
-
 SBR PRO
pampano welcome sir
I like what u want to do. Get Justin that info he will help you with this. He is a great guy, not to mention very savy in sports betting. I believe this would be great for guys like myself who love to bet golf 
-

Originally Posted by
MonkeyF0cker

You need to read up on statistics, regression analysis, and distributions. I can guarantee you that nobody will help you build your model. But with enough research, you will find the methods for accomplishing that very mission.
Yeah I didn't expect someone to hand a (close to) turn key solution over.  But I find it hard to nobody would want to at least give some pointers on books, articles etc to read up on in order to get started.
-
Originally Posted by
Justin7
Another thing you need - for each score, you need a course difficulty. Instead of using raw scores for each player, I'd use a "handicap versus course difficulty".
So if a course has an average of 69 for the top 100 players, and a player hit a 68 on it, I'd record a "-1" for that player at that course. The 68 number is almost worthless.
Yes, as I mentioned it's the adjusted average scoring that is to be used. It's the players total strokes added to an adjustment divided by the rounds played. The adjustment (per round) is the fields stroke average (per round) subtracted from par.
So if the field avg for round 1 is 69.3 on a par 72 round and the player shoots a 68 he will be marked for an adjusted 70.7
Round 2 the field averages 69.4 and our player shoots a 69 he will be adjusted to 71.6 etc This would take the course difficulty into account on a per round basis. (different pin placements, weather conditions etc)
The same goes for putting. It's not the direct putting average that's important but putting per greens in regulation. If a player is bad at the approach shots and misses the green he will have a lower putt count since he is often chipping in his 3rd stroke on a par 4 which should reduce his putt count. Counting the GIR putts only will be more accurate. Of course in the next step this could also be adjusted against the fields GIR putting average as with the adjusted scoring above.
Originally Posted by
Justin7
If you collect the data and are willing to spend time developing this model, I'll be happy to work with you.
I thank you for this. 
I've looked around on forums but haven't seen much golf betting discussed in terms other than "I have a feeling" and "hunches" that a player would have value at a certain price.
At one forum I only got the response "Golf involves magic, and magic is unquantifiable.".
There are tons of odds compilers working every day on this and I can't imagine them going on merely hunches or believing in magic 
-
Originally Posted by
Pompano
There are tons of odds compilers working every day on this and I can't imagine them going on merely hunches or believing in magic
I know oddsmakers offshore and in Vegas. You'd be amazed if you knew some of the ways they set lines. And not in a good way. Anyone who has a solid foundation in mathematics and applies it in a disciplined manner in sports will win, no matter what the sport.
-
Ok so as for the problem with normalizing the data to come up with a ranking number.
I have this 1st draft of a stats weight system (in no means finished) that assigns each piece of data a % weight totalling up to 100%
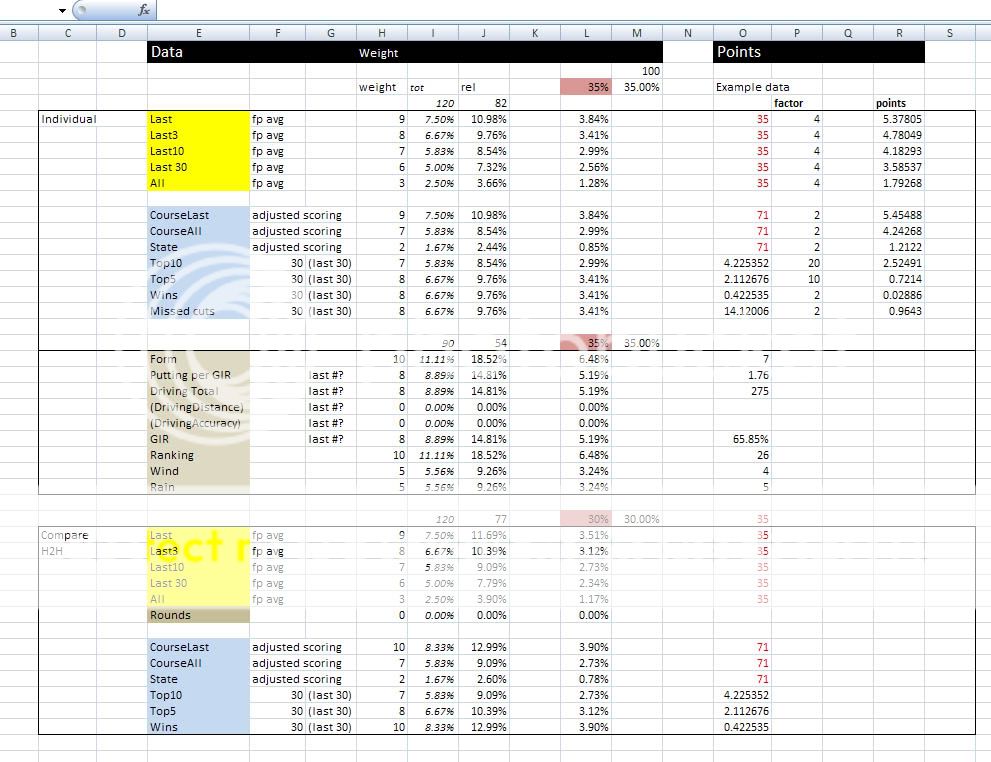
But I was thinking that the problem with normalizing the data under the "points" columns to produce a total, which can be compared to other players totals, each row could be compared to the other players resulting in a "score point" (like 100 points for the top10 players, 90 points for top11-20 etc etc). The score points are then weighted and added up to a total which would be the players total ranking points.
I think this would take considerably more work to implement in code but if it would give the best end result, it's obviously the way to go.
-
try this:
For each player, come up with 2 scores: His "course handicap", and his standard deviation.
If you want to set odds on a head to head matchup, it's easy from that point. It's harder to do "who will win" odds, but those are typically juiced alot more also.

 Reply With Quote