Hard to believe but it has been another month and it is time to see how my long term stock choices are doing. These are mainly stuff i will hold for over a year, or speculative things that I am willing to plop down a few dimes on and wait for a while to see if they come through.
AQB AquaBounty Technologies
These are the one growing frankenly geneticly modified salmon and have just started to ramp up their farming capabilities to a more industrial level. They are currently transitioning from a bunch of lab coats with a special fish jiz, to a meat provider complete with dis-assembly lines. They recently just had another public offering to raise cash to build a facility in kentucky, because when you thin of salmon, Kentucky is where you go.
Anyway, lets start with the 2 year chart with weekly candles.
OK this stock was plotting along with almost no volume until around last September when price spiked up to tag the $5.24 level (point #1), got rejected back down to the 3.80's level where there was support before it busted the fuk out and made a high in late January when I stepped out at around $13.32. Then ever since then it has been in a little bit of a free fall. I bought back in at $9.55 in February only to to see the price come back and test a former resistance level of $5.24,(point #2) in early March. All this time it has had higher than normal volume. It bounced off of support only to get rejected at the $8.15 level. Since then it has come back down to test the $5.24 price again just recently which just happens to also coincide with the 50 DMA.
Now lets look at the monthly chart.
You can see on the monthly chart where the support ling is at $5.24, and in January when it made its high price just how far away from the 20 period moving average it was. As you know my belief is that the 20 period moving average is magnetic and a price doesn't get too far away from that line before it either hangs out and waits to the line to come up, or it snaps back to the line. In this case, the price is snapping back to the line. At this point the 20 month moving average is at $4.03 (not labeled). They come out with earnings on Tuesday after the close, and they are too small to make Iona's earnings report chart so don't look for it there, but I suspect they will put in some substantial losses due to the growing pains of building a new facility. I'm a buyer of another couple of hundred shares when the monthly 20 period moving average is met, probably next month some time when the price comes down a little more and the 20 period moving average comes up a little.
TOTALS ALL STOCKS 2021 92,605.40 -12,355.55 -1,775.05 2,300.90 MONTH APR IN 6,797.40 ALLOWED -550.55 GAIN SO -103.05 TOTAL 16.90 TOTALS PER STOCK AQB PLAY 1,910.00 LOSS -1,010.00 FAR -776.00 GAIN 2,298.00 MONTH APR 0.00 0.00 0.00 0.00 . DATE TIME STOCK
TICKERSHARES BEGIN
BUY/SELL
PRICETOTAL
IN PLAYSTOP LOSS/
BUY MORE
PRICEALLOWABLE
LOSS TOTALALLOW
LOSS
% TOTALTODAY'S
CLOSE/END
PRICEGAIN/LOSS
SO FAREND
SHARESEND
BUY/SELL
PRICEEND
GAIN/LOSSEND
%
GAIN/LOSSTOTAL
GAIN/LOSSTOTAL
%
GAIN/LOSSPARTIAL 1
SHARESPARTIAL 1
BUY/SELL
PRICEPARTIAL 1
GAIN/LOSSPARTIAL 1
%
GAIN/LOSSPARTIAL 2
SHARESPARTIAL 2
BUY/SELL
PRICEPARTIAL 2
GAIN/LOSSPARTIAL 2
%
GAIN/LOSSPARTIAL 3
SHARESPARTIAL 3
BUY/SELL
PRICEPARTIAL 3
GAIN/LOSSPARTIAL 3
%
GAIN/LOSS02/05/21 12.16.00 AQB 200 9.55 1,910.00 4.50 -1,010.00 -52.88% 5.67 -776.00
From the stock particulars, I have a almost $2300 profit from my first sell this year when it was at a high in Jan, but since then my losses are starting to eat into that profit.
|
|
Best Sportsbooks List
|
|
| |||||
| #1 FanDuel | SBR rating 4.8/5 | Review | #6 BetRivers | SBR rating 4.1/5 | Review | #2 Caesars | SBR rating 4.7/5 | Review | #7 Fanatics | SBR rating 4.1/5 | Review |
| #3 DraftKings | SBR rating 4.7/5 | Review | #8 Betway | SBR rating 3.8/5 | Review | ||
| #4 BetMGM | SBR rating 4.6/5 | Review | #9 Borgata | SBR rating 3.5/5 | Review | ||
| #5 bet365 | SBR rating 4.6/5 | Review | #10 ClutchBet | SBR rating 2.9/5 | Review | ||
-
05-02-21 05:37 PM #9766

-
05-02-21 06:05 PM #9767
Yeah, I'm chopping it up this month in several post just to change things up a little, also I noticed that the longer the post the more screwy the posting systems become.
EVFM EvoFem Biosciences Inc.
The makers of the female contraceptive that is non hormonal. Homronal of course is the ingredient known as the active one in typical women's contraceptive stuff which turns on the bitch factor. Basically most of the women's pills make it so you don't want to fuk her in the first place thus being highly effective. This new "Phexxi", or magi-lube as it is know is rumored to come in Bubble gum, Cheri, Banana, Strawberry, and of course Agua Advantage Salmon flavors. Just this week they came out with a press release of them going to a groin-ocologist convention somewhere to unveil their news is flavor Winter Fresh Spearmint so be on the lookout for that.
Anyway lets look at the 2 year chart with weekly closes.

This is a pretty ugly chart with a steady march down. This company has been dipping into the additional offering of shares every couple of months and it is starting to really show. It's go time for Magi lube and they show show some signs of life here pretty soon. The only thing I have in my favor with this one is that the stochastics are way down in the oversold area and have a look of a cross over coming here.
Now lets look at the 3 year chart with monthly closes.

Not much help here either on the monthly chart.. They report on Thursday after the close and again Iona's chart will not pick up this stock on the list as it really shouldn't. I suspect they put up another loss and further pain is probably on tap here for the near future. This stock needs to get going and they should be announcing better marketing gimmicks other than renting out a booth at a crouch-o-cologist convention next to the manufacturer of new and improved stainless steel pussy inspection tools that aren't cool to the touch called the cozy coochi looker. Hell they took out some money in new stock for the express purpose of advertising, time to make it happen.
TOTALS ALL STOCKS 2021 92,605.40 -12,355.55 -1,775.05 2,300.90 MONTH APR IN 6,797.40 ALLOWED -550.55 GAIN SO -103.05 TOTAL 16.90 TOTALS PER STOCK EVFM PLAY 3,316.00 LOSS -1,441.00 FAR -1,081.00 GAIN 324.00 MONTH APR 0.00 0.00 0.00 0.00 . DATE TIME STOCK
TICKERSHARES BEGIN
BUY/SELL
PRICETOTAL
IN PLAYSTOP LOSS/
BUY MORE
PRICEALLOWABLE
LOSS TOTALALLOW
LOSS
% TOTALTODAY'S
CLOSE/END
PRICEGAIN/LOSS
SO FAREND
SHARESEND
BUY/SELL
PRICEEND
GAIN/LOSSEND
%
GAIN/LOSSTOTAL
GAIN/LOSSTOTAL
%
GAIN/LOSSPARTIAL 1
SHARESPARTIAL 1
BUY/SELL
PRICEPARTIAL 1
GAIN/LOSSPARTIAL 1
%
GAIN/LOSSPARTIAL 2
SHARESPARTIAL 2
BUY/SELL
PRICEPARTIAL 2
GAIN/LOSSPARTIAL 2
%
GAIN/LOSSPARTIAL 3
SHARESPARTIAL 3
BUY/SELL
PRICEPARTIAL 3
GAIN/LOSSPARTIAL 3
%
GAIN/LOSS02/26/21 10.30.46 EVFM 200 3.82 764.00 1.25 -514.00 -67.28% 1.49 -466.00 03/04/21 15.03.30 EVFM 100 3.30 330.00 1.25 -205.00 -62.12% 1.49 -181.00 03/05/21 9.30.24 EVFM 100 2.41 241.00 1.25 -116.00 -48.13% 1.49 -92.00 03/05/21 10.13.00 EVFM 100 2.16 216.00 1.25 -91.00 -42.13% 1.49 -67.00 03/25/21 09.31.54 EVFM 500 1.80 900.00 1.25 -275.00 -30.56% 1.49 -155.00 03/25/21 14.58.31 EVFM 500 1.73 865.00 1.25 -240.00 -27.75% 1.49 -120.00
So the day after I bought some of this it shot right up and I took my $324 profit. Then I started to step back in and now I need a good $0.60 gain in the stock price to break even. Of course I'm in it for the loner haul but it is inching towards my fuk it price of $1.25. That is where I have deemed it too much. If it closes a weekly candle below that, I'm out and gone, and they can come out with all the new flavors they want before I come back in.
-
05-02-21 06:10 PM #9768
Slurry I was thinking of you when wrote that last post with the chart.
https://www.sportsbookreview.com/for...l#post30246178
I know you can't see volume in that chart, but I've been showing over the years that stocks and sports aren't all that different.
By the way, the Fund lost today's play with MIL.
The chart looks like it's going to keep heading negative for sure.
-
05-02-21 06:47 PM #9769
KVB it's making lower highs and lower lows for sure. All my longer term stuff has been slowly bleeding me, I don't have any winners in the longer than 1 month camp for the last year.
Lets look at:
AU AngloGold Ashanti LTD.
This gold miner has been killing it with the reports and no body cares. I think the market will eventually come around and the gold miners will be back in the saddle before the end of the year. Waiting is taking a toll on me however so this probably explains why I like to scalp trade on a daily basis. Kind of like betting on a football game with a 3 hours horizon.
Anyway lets look at the 2 Year chart with weekly closes.

Not much to see here the price has been bouncing around in a range which just happens to be the 50% and 61.8% fibo retracement levels. A look at my Trend-o-meter shows that is is pretty low, and the stochastics also show it has a way to go to be oversold. This and all the other gold related stocks are just waiting for a reason to explode.
TOTALS ALL STOCKS 2021 92,605.40 -12,555.55 -2,143.05 2,300.90 MONTH APR IN 6,797.40 ALLOWED -550.55 GAIN SO -103.05 TOTAL 16.90 TOTALS PER STOCK AU PLAY 9,519.00 LOSS -1,719.00 FAR -1,287.00 GAIN 0.00 MONTH APR 0.00 0.00 0.00 0.00 . DATE TIME STOCK
TICKERSHARES BEGIN
BUY/SELL
PRICETOTAL
IN PLAYSTOP LOSS/
BUY MORE
PRICEALLOWABLE
LOSS TOTALALLOW
LOSS
% TOTALTODAY'S
CLOSE/END
PRICEGAIN/LOSS
SO FAREND
SHARESEND
BUY/SELL
PRICEEND
GAIN/LOSSEND
%
GAIN/LOSSTOTAL
GAIN/LOSSTOTAL
%
GAIN/LOSSPARTIAL 1
SHARESPARTIAL 1
BUY/SELL
PRICEPARTIAL 1
GAIN/LOSSPARTIAL 1
%
GAIN/LOSSPARTIAL 2
SHARESPARTIAL 2
BUY/SELL
PRICEPARTIAL 2
GAIN/LOSSPARTIAL 2
%
GAIN/LOSSPARTIAL 3
SHARESPARTIAL 3
BUY/SELL
PRICEPARTIAL 3
GAIN/LOSSPARTIAL 3
%
GAIN/LOSS09/02/20 11.27.15 AU 300 28.01 2,801.00 19.50 -851.00 -30.38% 20.58 -743.00 85 28.51 42.50 1.79% 115 28.57 64.40 2.00% 10/22/20 15.39.11 AU 100 25.50 2,550.00 19.50 -600.00 -23.53% 20.58 -492.00 11/24/20 14.15.24 AU 200 20.84 4,168.00 19.50 -268.00 -6.43% 20.58 -52.00
So far I don't have any buys or sells this year. I will buy more if and when it gets back down to the $19.50 level, but until then, I'm forgetting about even owning this stock.
-
05-02-21 07:19 PM #9770
GDX VanECK Vectors Gold Miners ETF
This is the ETF of gold miners and is usually always in my portfolio in some capacity.
Lets see how this 2 year weekly chart looks.

This chart looks a little better. Almost like the entire sector is starting to turn the corner. It came down and bounced off of the 50% Fib retracement level only to get smacked back down when it ran up to the 50 week moving average. It just on Friday closed 1 cent above the 20 week moving average. My trend-o-meter actually has turned green even though it is pretty far down on the percentage level. The volume ha been on a steady decline slowly putting investors to sleep with the performance of doing practically nothing for a while. If you look at the last couple of months work however, the chart is starting to make higher highs and higher lows. Everything needs to start at some point and hopefully this is the start of the bull cycle.
TOTALS ALL STOCKS 2021 92,605.40 -12,555.55 -3,078.05 2,300.90 MONTH APR IN 6,797.40 ALLOWED -550.55 GAIN SO -103.05 TOTAL 16.90 TOTALS PER STOCK GDX PLAY 19,242.00 LOSS -4,117.00 FAR -344.00 GAIN 0.00 MONTH APR 0.00 0.00 0.00 0.00 . DATE TIME STOCK
TICKERSHARES BEGIN
BUY/SELL
PRICETOTAL
IN PLAYSTOP LOSS/
BUY MORE
PRICEALLOWABLE
LOSS TOTALALLOW
LOSS
% TOTALTODAY'S
CLOSE/END
PRICEGAIN/LOSS
SO FAREND
SHARESEND
BUY/SELL
PRICEEND
GAIN/LOSSEND
%
GAIN/LOSSTOTAL
GAIN/LOSSTOTAL
%
GAIN/LOSSPARTIAL 1
SHARESPARTIAL 1
BUY/SELL
PRICEPARTIAL 1
GAIN/LOSSPARTIAL 1
%
GAIN/LOSSPARTIAL 2
SHARESPARTIAL 2
BUY/SELL
PRICEPARTIAL 2
GAIN/LOSSPARTIAL 2
%
GAIN/LOSSPARTIAL 3
SHARESPARTIAL 3
BUY/SELL
PRICEPARTIAL 3
GAIN/LOSSPARTIAL 3
%
GAIN/LOSS09/04/20 10.29.46 GDX 50 39.91 1,995.50 27.50 -620.50 -31.09% 34.36 -277.50 09/21/20 10.13.53 GDX 50 40.10 2,005.00 27.50 -630.00 -31.42% 34.36 -287.00 10/22/20 15.50.42 GDX 50 39.20 1,960.00 27.50 -585.00 -29.85% 34.36 -242.00 10/26/20 11.13.22 GDX 50 38.63 1,931.50 27.50 -556.50 -28.81% 34.36 -213.50 11/24/20 14.12.15 GDX 200 33.65 6,730.00 27.50 -1,230.00 -18.28% 34.36 142.00 03/01/21 13.08.58 GDX 150 30.80 4,620.00 27.50 -495.00 -10.71% 34.36 534.00
I seem to be complaining like a little bitch when I realize that I have 19 Grand in play and I'm only down a little less than $350. it seems like its more than that in my mind but whatever, I'll take it. I'll buy more if it comes back down to the $27.50 level.
Now for a Bone Us look at the 3 Month chart with daily closes.

Just on Friday the stock closed right in the upper portion of a buy zone for a swing trade for all of yous out there wondering about when to try a swing (couple of days to a couple of weeks) trade. The zone starts at the current level and goes down to about $33.80. Below that and it is cut and run time. It broke out of a small consolidation period to run up towards the 200 DMA, now it is coming back down to retest a former breakout area and the 50 DMA. If it bounces this time it will almost assuredly be back at the 200 DMA which would be my first exit point. Of course I would hang on to about half the shares in case it breaks through the 200 DMA to see if it can catch a ride up the ladder.
-
05-02-21 07:45 PM #9771
Now for my single biggest holding.
GLD SPDR Gold Trust ETF
So I like to have around 50 grand or so in paper gold every year, and at the end of the year, I take 10 grand out of the market and buy gold chunks. lately I've been buying 5 oz chunks because they are acceptable for me to jam up my ass if I need to do it. I'm not a whore enough to be able to jam a 10 oz bar up there, and a 10 oz bar would be too much for me to convert on a yearly basis. If it all goes to plan, I'll be giving these to the fukking kids when I take the dirt nap and they will probably squander it on a weekend in Vegas snorting cocaine off of the room service tray with a bunch of hookers. At least that is what I would do if I were them.
Lets look at the 3 year chart with monthly closes.

This one made a high and since then it has been on a steady decline. If you look at the difference between the high price and the 20 period moving average, you can see that the 2 are magnetically attracted and just last month they came back together with the price of gold bottoming or trying to at least. It bounced and tried to break out of the downward channel only to be dragged back in last week.
TOTALS ALL STOCKS 2021 92,605.40 -12,555.55 -3,300.05 2,300.90 MONTH APR IN 6,797.40 ALLOWED -550.55 GAIN SO -103.05 TOTAL 16.90 TOTALS PER STOCK GLD PLAY 49,460.00 LOSS -3,479.00 FAR 238.00 GAIN -357.25 MONTH APR 0.00 0.00 0.00 0.00 . DATE TIME STOCK
TICKERSHARES BEGIN
BUY/SELL
PRICETOTAL
IN PLAYSTOP LOSS/
BUY MORE
PRICEALLOWABLE
LOSS TOTALALLOW
LOSS
% TOTALTODAY'S
CLOSE/END
PRICEGAIN/LOSS
SO FAREND
SHARESEND
BUY/SELL
PRICEEND
GAIN/LOSSEND
%
GAIN/LOSSTOTAL
GAIN/LOSSTOTAL
%
GAIN/LOSSPARTIAL 1
SHARESPARTIAL 1
BUY/SELL
PRICEPARTIAL 1
GAIN/LOSSPARTIAL 1
%
GAIN/LOSSPARTIAL 2
SHARESPARTIAL 2
BUY/SELL
PRICEPARTIAL 2
GAIN/LOSSPARTIAL 2
%
GAIN/LOSSPARTIAL 3
SHARESPARTIAL 3
BUY/SELL
PRICEPARTIAL 3
GAIN/LOSSPARTIAL 3
%
GAIN/LOSS11/24/20 13.39.32 GLD 100 169.60 16,960.00 153.27 -1,633.00 -9.63% 165.66 -394.00 02/26/21 3.58.22 GLD 200 162.50 32,500.00 153.27 -1,846.00 -5.68% 165.66 632.00
If you add up my losses from an earlier sell to convert a little bit to real gold, and the slight profit so far this year, you can see that I am almost even. Remember the game is to get 10 grand out of it so that the chunk I can shove up my ass are paid for via market gains every year. I'm a buyer of more if the price falls apart and comes back down to the $153.57 level. I don't think it will get there, but if it does, I'm loading up some more.Nomination(s):This post was nominated 1 time . To view the nominated thread please click here. People who nominated: Gonad
-
05-02-21 08:35 PM #9772
What about silver you ask. Well i started to own that too now. So if you're taking notes I own the only 2 commodities that are not shooting through the roof right now. Every other thing that is extracted through a mining operation right now is flying high.
SLV Ishares Silver Trust ETF
You know the drill off to the 3 year monthly chart.

Silver has an interesting chart. On the one hand we have a bull flag sort of thing going on,shown by the magenta lines, then on the other hand there is a bearish flag pattern going on as well, shown in blue. The price has been in a range for a few months going sideways waiting for the 20 month moving average to creep up to get closer to the price. it is still pretty far away but it isn't that bad yet. I'm going to hold this position for now.
TOTALS ALL STOCKS 2021 92,605.40 -12,555.55 -3,313.05 2,300.90 MONTH APR IN 6,797.40 ALLOWED -550.55 GAIN SO -103.05 TOTAL 16.90 TOTALS PER STOCK SLV PLAY 2,361.00 LOSS -239.00 FAR 40.00 GAIN 0.00 MONTH APR 0.00 0.00 0.00 0.00 . DATE TIME STOCK
TICKERSHARES BEGIN
BUY/SELL
PRICETOTAL
IN PLAYSTOP LOSS/
BUY MORE
PRICEALLOWABLE
LOSS TOTALALLOW
LOSS
% TOTALTODAY'S
CLOSE/END
PRICEGAIN/LOSS
SO FAREND
SHARESEND
BUY/SELL
PRICEEND
GAIN/LOSSEND
%
GAIN/LOSSTOTAL
GAIN/LOSSTOTAL
%
GAIN/LOSSPARTIAL 1
SHARESPARTIAL 1
BUY/SELL
PRICEPARTIAL 1
GAIN/LOSSPARTIAL 1
%
GAIN/LOSSPARTIAL 2
SHARESPARTIAL 2
BUY/SELL
PRICEPARTIAL 2
GAIN/LOSSPARTIAL 2
%
GAIN/LOSSPARTIAL 3
SHARESPARTIAL 3
BUY/SELL
PRICEPARTIAL 3
GAIN/LOSSPARTIAL 3
%
GAIN/LOSS01/22/21 10.03.24 SLV 100 23.61 2,361.00 21.22 -239.00 -10.12% 24.01 40.00
I would like to buy more but I'm going to wait until the price makes its move first, of course I would like to buy it cheaper so $21.22 is my preferred price, if it breaks out and runs, I'll have to wait for it to comeback and retest the breakout area before I jump back on board.
-
05-04-21 10:42 PM #9773
Todays positions For earnings
STO Lyft 50/62.5 may expire strangle
STO Z 105/150 may expire strangle
STO GM 50/60 strangle weekly expire
BTC UAA 20/27.5 strangle weekly expire 90% profit.
lyft and z should be big winners after no blow out moves after the bell. Gm tomorrow morning. Will close all positions unless IV rank is still elevated.
-
05-04-21 11:05 PM #9774
Also thinking about selling call credit spread in corn or soybean. It’s so crazy inflated. Maybe oil too if it crosses 67 dollars.
bought a put debit spread on spy While IV is still low to hedge my deltas.Last edited by antifoil; 05-04-21 at 11:09 PM. Reason: Debit not credit
-
05-06-21 10:26 AM #9775 Need help
Good morning,
Hoping someone can help me understand the following disclosure and what this means for my investment and the stock price. I own 2,000 shares (LIACF) at CB circa 2.10. Currently trading circa 1.75. It seems to me that this may create an artificial ceiling circa $2.00?? They are about to acquire PLUUF within days.
Any help much appreciated.
"The CFO bought 250,000 shares at $2. Which includes warrants to buy additional shares at $3 until April 2024. And someone else bought another 7M+ shares under same conditions. This means they have confidence that $2 is a fair price and that the stock will most likely be over $3 within 2 years from now."
-
05-06-21 12:43 PM #9776
Whoever mentioned WW recently, NICE CALL!!!
-
05-06-21 02:18 PM #9777
I keep averaging down but just no bottom in these nazzy stocks.
PENN have great earnings, down another 10 bucks
so sick of this shit
-
05-06-21 04:19 PM #9778
Im getting destroyed too..the thread has died off also. I'm sure many are discouraged. Lots of posting when there's a hot bull market. I'm just holding thru the storm..may take months to years but we'll be back
-
05-06-21 04:27 PM #9779
The biden effect gaining steam... yippee!
 Originally Posted by whydubya

-
05-06-21 05:36 PM #9780
I've dropped numerous great runners....you guys just don't want to accept value is the new growth...you need to be like Gumbi and understand the macro and adjust your game Originally Posted by whydubya
-
05-06-21 09:31 PM #9781
Guys is there any ethereum or dodgecoin ETF?
-
05-07-21 10:19 AM #9782
FSLY 25% drop cost much money on my earning play. now i am stuck with an inverted strangle trying to squeeze out more premium. Etsy big drop was a scratch after today.
big win with a DKNG put, and SQ stangle, and pton put credit spreads.
-
05-07-21 02:08 PM #9783
I'm getting ready to catch that knife with DKNG at $47.65, $47.50,$47.35 and $47.20 if it gets there. Probably give it a dollar or so to react from there before I cut and run. Originally Posted by antifoil
-
05-07-21 04:54 PM #9784
Anyone know if it's possible to short cryptocurrencies? I had Meryll Edge and Schwab.
-
05-07-21 06:12 PM #9785
Hey all of the woe is me crowd from a tightening market that has lost all of the quick gainers you have become accustom to. I'm here to tell you that the rotation is happening. Like Mr. Trobin31 says, maybe not in his last post but sometime recently, oil is the new green new deal. I work in the oil patch industry and with Biden putting the screws to domestic oil production with killing pipelines and surely making it hard to drill for anything, oil and oil service companies are coming alive again. Sounds counter intuitive but it is a world wide thing and if the black gold isn't coming from the U.S, you can bet it is coming from somewhere like the middle east.
Add in a little old school tension from competing countries and wou have the making of a big rally in some sectors.
Its not only oil, industrials and materials are all the shit lately. Name something that comes out of the ground and it is going up. Even Gold for Christ sake is finally starting to move. So try out some XLI, XLB, and of course the XLF because the financials are always in the mix for some reason.
-
05-07-21 09:26 PM #9786
I told folks about RECAF weeks ago. Anyone buy? Up 24 g's on that in 3 weeks.
-
05-08-21 01:39 AM #9787
Ever hear of Phillip Rivera Sr or drilling structures int. My uncle who just died.
-
05-08-21 10:24 AM #9788
-
05-08-21 04:10 PM #9789
Ransomware attack forces shutdown of largest fuel pipeline in the U.S.https://www.cnbc.com/2021/05/08/colo...berattack.html
-
05-08-21 04:14 PM #9790
The only other thing I can assure you will moon besides BTC and ETH in 2021...is OIH...take your mortgage and life savings and send it to the gas pump is the only logical conclusion one can draw from the few months of 2021. Originally Posted by trobin31
This is coming from the same guy who told you to buy the snot out of every single stay at home play this time last year...don’t come back here saying this place is dead...U r losing money...if you are losing money it’s because u r not fuk’n listening
this and bitcoin thread are literally the only profitable threads in history of SBR
-
05-10-21 06:43 AM #9791
Looks like my painful journey of buying and holding everything gold is starting to turn around. I am also starting to hear about the stagflation word. If you remember, I told about stagflation way back in later parts of last year. This is also the month I expected the downturn to start. It almost happened in February, but I always thought that May was the time period for that. I'm still sticking with the gold plays, and a light step into shorting the IWM for now that will pick up if my prediction is correct. If the market doesn't turn this month, it appears we will have to wait until the August time frame for that to happen. Either way the big ship S.S. Economy is taking a hard left turn and is taking on water after hitting that liberal iceberg, and as the band plays on in the state rooms, the underlying fundamentals are starting to sink the ship.
-
05-10-21 06:55 AM #9792
Talk to chico 3 or 4 times a week, says hello to all. Hope he goes home soon and gets back here, a normal life again. Originally Posted by chico2663

-
05-10-21 11:23 AM #9793
I went heavy into OIH@215, could be 400-600 by years end
-
05-10-21 11:28 AM #9794
Thanks BOA12. Originally Posted by BOA12
Get well Chico!!!

-
05-10-21 02:18 PM #9795
Good food makes the stay tolerable; under good care and making progress. Let him know his bros, in high finance, need him back Originally Posted by KVB
-
05-10-21 02:21 PM #9796
Today is as close to Black Monday for me as it gets. My portfolio is soaked in red. Probably my worst day ever since I started trading.
-
05-10-21 03:48 PM #9797
STO SPCE 15/22 strangle may 21 expire and 15/23 strangle June expire. Both appear to be big winners at the open. Will definitely close them.
STO RBLX 58/75 strangle may 21 expire and 55/80 June expire. Appear to be big winners.
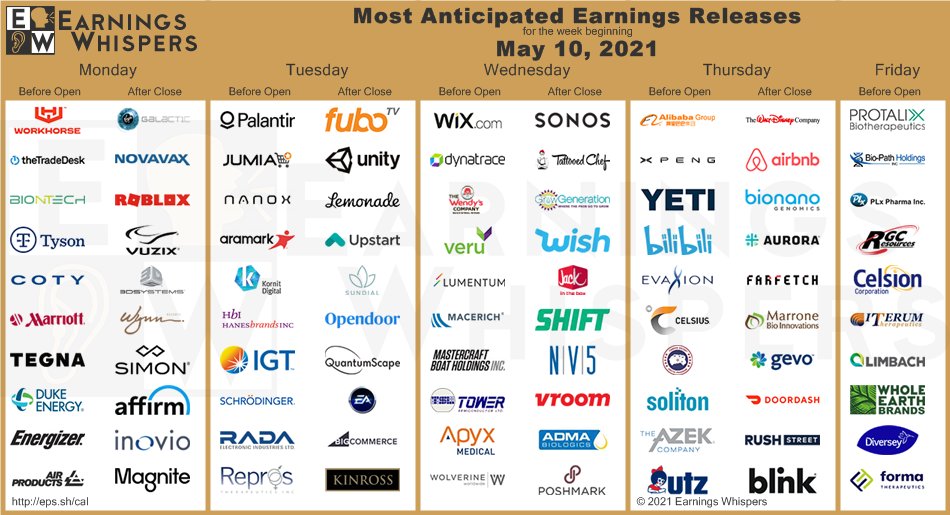
PLTR 16/22 strangle may 21 expire and 15/23 June expire. Earnings tomorrow.
had to roll most all of my positions call side down to get back to delta neutral. Some to straddles and some to inverted strangles to drain more premium before deciding how to handle it.
-
05-10-21 04:23 PM #9798
Nasdaq got the curb stomp today and closed right on the 50 day moving average. I stepped in a shorted it today, so you know it will rebound tomorrow.
-
05-10-21 04:25 PM #9799
I listened..bought many of the growth stocks in disruptive industries (insurance, advertising, AI, etc.). That whole growth sector has gotten mauled. Nothing to do but hold now. Will play your real time live tips moving forward with new powder. Originally Posted by trobin31
-
05-10-21 04:29 PM #9800
What price do you think BTC and ETH will be in 2023, two years from now? Originally Posted by trobin31


 Reply With Quote