COVID-19: What’s New for April 21, 2020Main updates on IHME COVID-19 predictions since April 17, 2020
MORE DATA, IMPROVED MODELS, BETTER ESTIMATESOur last release on
April 17 involved a number of model updates and innovations, namely substantially improving our death model and including initial predictions on when US states could safely consider easing current social distancing policies while shifting to robust containment strategies (widely available testing, contact tracing and case-based isolation, restrictions on mass gatherings).
With no substantive model changes since April 17, today’s release provides an update with new data for Europe and the US. We also aim to release initial estimates for a number of Latin American countries soon, as well as those for Puerto Rico and by province in Canada. The next update will provide a more in-depth discussion around key findings for Europe and the US.
KEY FINDINGS FROM TODAY’S RELEASE (APRIL 21, 2020)A focus on when US states could consider easing social distancing if containment measures are in placeToday’s release involves the second iteration of projecting when states may be able to consider easing currently implemented social distancing policies
– if and only if – strong containment measures already have been instituted. Based on the latest available data and updated predictions of COVID-19 prevalence, the table below outlines potential timing of these considerations.
Estimates from today’s release suggest that 30 states may fall below the 1 prevalent case per 1,000,000 threshold during May (greens to the light yellow in the map below). As further detailed in the
April 17 update, this threshold is considered a conservative estimate of the number of COVID-19 infections that states could reasonably identify via active case detection and contact tracing.
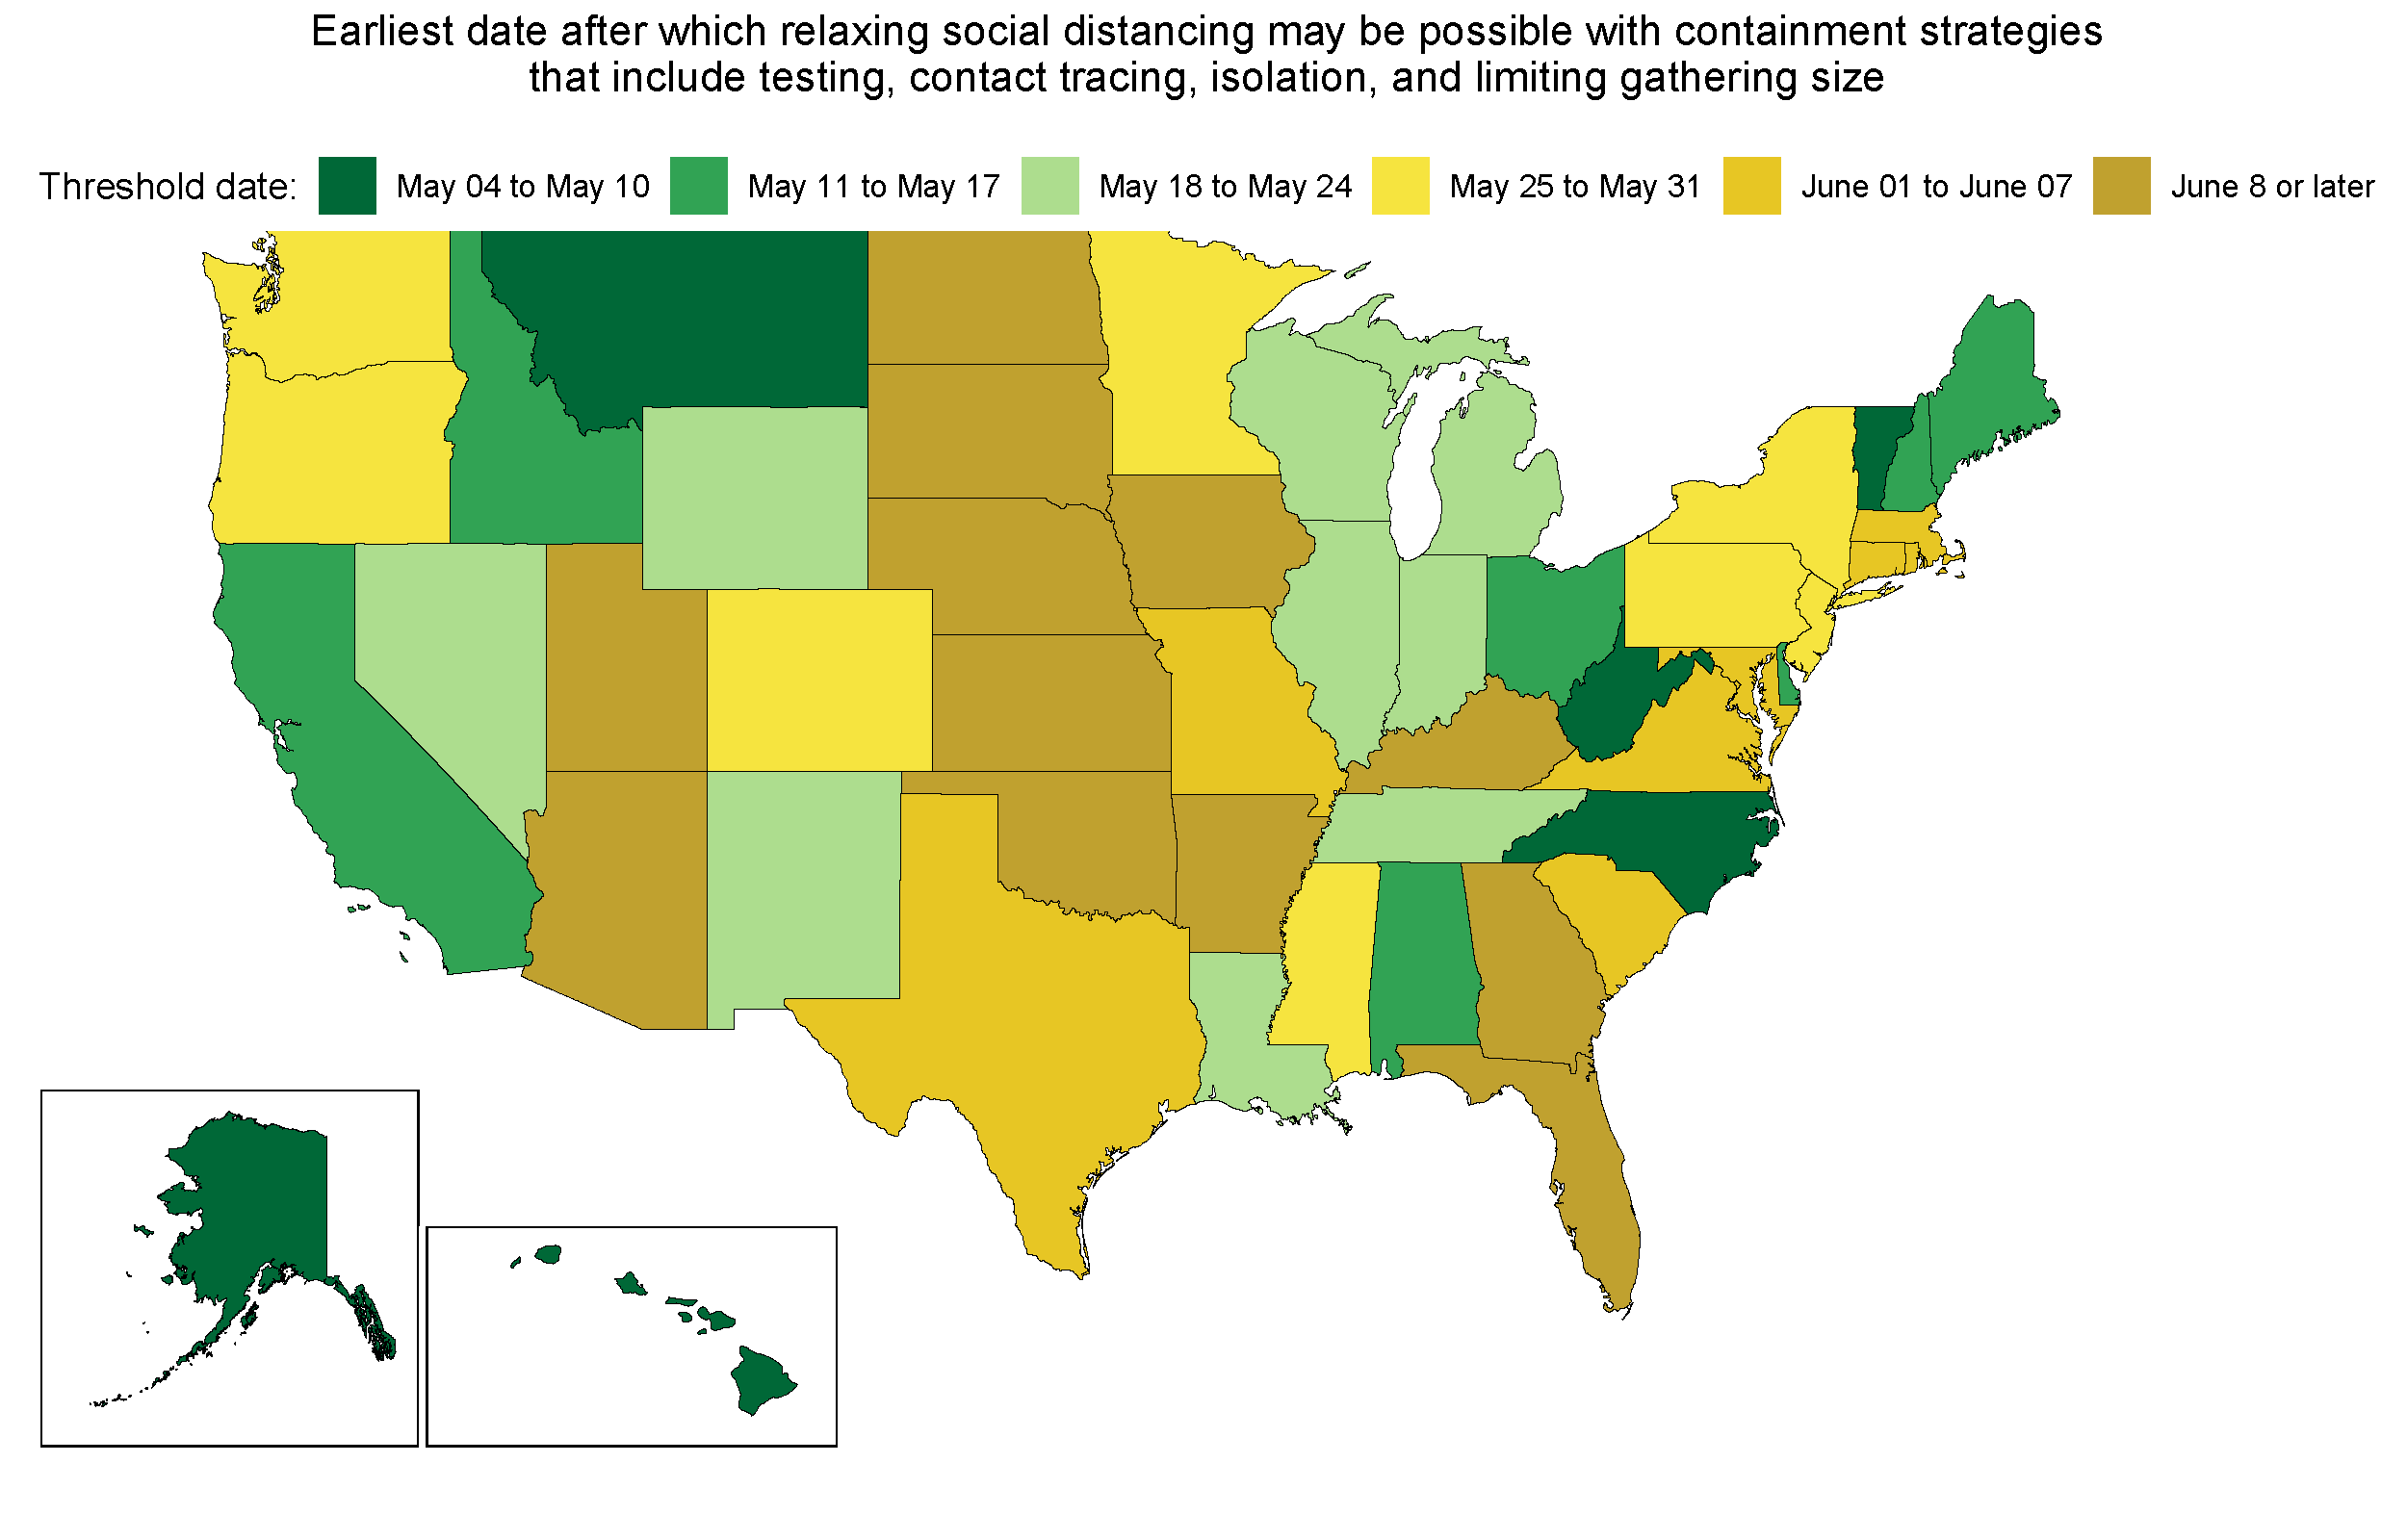
Current trajectories indicate that 12 states may need to wait until at least June 8 or beyond that time before they fall below the 1 prevalent infection per 1,000,000 threshold. These projections could change as new data become available or different policies are implemented.
Results from today’s release indicate these projected “threshold” dates are, on average, later than those released on April 17. Arizona, Florida, Kansas, and North Dakota had the largest shifts to later dates. The main driver of these later predictions is the increase in reported deaths since the last release, as well as predictions of longer (and flatter) epidemic peaks for several states. The table below shows predicted dates for each release, with states listed in alphabetical order.
When might US states safely shift to containment strategies?Prediction of the earliest week to potentially consider easing currently implemented distancing policies if strong containment measures (widely available testing, contact tracing, case-based isolation, and restrictions on mass gatherings) are already in place* |
State |
Today’s release (April 21) |
From the April 17 release |
Change since the April 17 release |
Alabama |
May 17 |
May 18 |
-1 day |
Alaska |
May 6 |
May 11 |
-5 days |
Arizona |
June 23 |
June 8 |
+15 days |
Arkansas |
June 20 |
June 22 |
-2 days |
California |
May 17 |
May 18 |
-1 day |
Colorado |
May 25 |
May 25 |
0 days |
Connecticut |
June 7 |
June 1 |
+6 days |
Delaware |
May 17 |
May 18 |
-1 day |
District of Columbia |
June 5 |
June 8 |
-3 days |
Florida |
June 11 |
June 1 |
+10 days |
Georgia |
June 19 |
June 15 |
+4 days |
Hawaii |
May 6 |
May 4 |
+2 days |
Idaho |
May 15 |
May 11 |
+4 days |
Illinois |
May 19 |
May 25 |
-6 days |
Indiana |
May 20 |
May 25 |
-5 days |
Iowa |
June 26 |
June 29 |
-3 days |
Kansas |
June 19 |
June 1 |
+18 days |
Kentucky |
June 11 |
June 8 |
+3 days |
Louisiana |
May 22 |
May 18 |
+4 days |
Maine |
May 13 |
May 18 |
-5 days |
Maryland |
June 5 |
June 8 |
-3 days |
Massachusetts |
June 7 |
June 8 |
-1 day |
Michigan |
May 19 |
May 18 |
+1 day |
Minnesota |
May 30 |
May 25 |
+5 days |
Mississippi |
May 30 |
June 1 |
-2 days |
Missouri |
June 7 |
June 1 |
+6 days |
Montana |
May 1 |
May 4 |
-3 days |
Nebraska |
June 30 |
June 29 |
+1 day |
Nevada |
May 18 |
May 18 |
0 days |
New Hampshire |
May 16 |
May 11 |
+5 days |
New Jersey |
May 27 |
June 1 |
-5 days |
New Mexico |
May 22 |
May 18 |
+4 days |
New York |
May 27 |
June 1 |
-5 days |
North Carolina |
May 10 |
May 11 |
-1 day |
North Dakota |
July 12 |
June 29 |
+13 days |
Ohio |
May 14 |
May 18 |
-4 days |
Oklahoma |
June 14 |
June 15 |
-1 day |
Oregon |
May 25 |
May 25 |
0 days |
Pennsylvania |
May 27 |
June 1 |
-5 days |
Rhode Island |
June 7 |
June 8 |
-1 day |
South Carolina |
June 5 |
June 1 |
+4 days |
South Dakota |
June 25 |
June 22 |
+3 days |
Tennessee |
May 20 |
May 25 |
-5 days |
Texas |
June 7 |
June 1 |
+6 days |
Utah |
June 21 |
June 15 |
+6 days |
Vermont |
May 8 |
May 4 |
+4 days |
Virginia |
June 5 |
June 8 |
-3 days |
Washington |
May 26 |
May 18 |
+8 days |
West Virginia |
May 7 |
May 4 |
+3 days |
Wisconsin |
May 21 |
May 18 |
+3 days |
Wyoming |
May 23 |
May 25 |
-2 days |

 Originally Posted by Mike Huntertz

 ..
..
 .
.
 JIBBBY gave Chi_archie 2 Betpoint(s) for this post.


 Reply With Quote