-
 Multilevel Regression / Lookup Table
I hope someone here can provide some guidance. I'm trying to learn how to do this via Stata and folks on YouTube but the language always gets too advanced/hard to follow and learn.
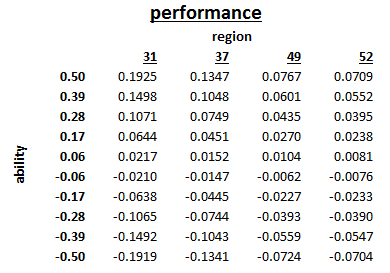
Basically, I have a factor in a model I'm building called "performance" that another factor "ability" predicts well. However, the factor is stronger when I group or cluster the information based on a "region" variable. There are dozens of regions. The screenshot of the data below shows what I mean.
Until now, I've been utilizing a lookup table, but as my model becomes more complex I'd like to achieve this using a formula. As I understand it, one way to do this would be a multilevel linear regression. The problem is understanding the output stata provides and creating a formula for it. Doing this on a simple linear regression is easy, but I don't know how to extend it out for multiple levels?
Below is some Stata output that could be completely wrong... but I hacked it together following some videos and trying to understand as best I could.
Mixed-effects ML regression Number of obs = 1058962
Group variable: region Number of groups = 20
Obs per group: min = 32
avg = 52948.1
max = 324484
Wald chi2(1) = 69270.53
Log likelihood = -293934.75 Prob > chi2 = 0.0000
perindex Coef. Std. Err. z P>z [95% Conf. Interval]
ability .2479351 .000942 263.19 0.000 .2460888 .2497814
_cons .000264 .0003104 0.85 0.395 -.0003443 .0008723
Random-effects Parameters Estimate Std. Err. [95% Conf. Interval]
region: Identity
var(_cons) 2.03e-15 2.94e-13 9.5e-139 4.3e+108
var(Residual) .1020044 .0001402 .10173 .1022795
LR test vs. linear regression: chibar2(01) = 0.00 Prob >= chibar2 = 1.0000
Is there anyone out there that can help?
Last edited by TravisVOX; 05-28-14 at 04:01 PM.
Reason: added example
-
Regressions of numbers that are largely subjective opens up a whole can of error-worms. Is this an independent variable of the model itself, or some sort of adjustment factor?
-
I don't understand what your question is? You just want to work around the lookup table? Basically a tool-specific question?
Why limit yourself to Stata? Maybe use a different tool, that is a little friendlier?
-

Originally Posted by
James Marques

Regressions of numbers that are largely subjective opens up a whole can of error-worms. Is this an independent variable of the model itself, or some sort of adjustment factor?
This are actual ratings based on historical stats in a holdout sample. I'm trying to develop this factor into something that improves the model.
-
Originally Posted by
Miz
I don't understand what your question is? You just want to work around the lookup table? Basically a tool-specific question?
Why limit yourself to Stata? Maybe use a different tool, that is a little friendlier?
No, my model is all built in Python. I use Stata to analyze data and then ultimately incorporate it into the model.
-
I used HLM7 for Hierarchical Linear Modelling during my post-grad Master's in Stats, probably more user friendly than using Stata.

 Reply With Quote